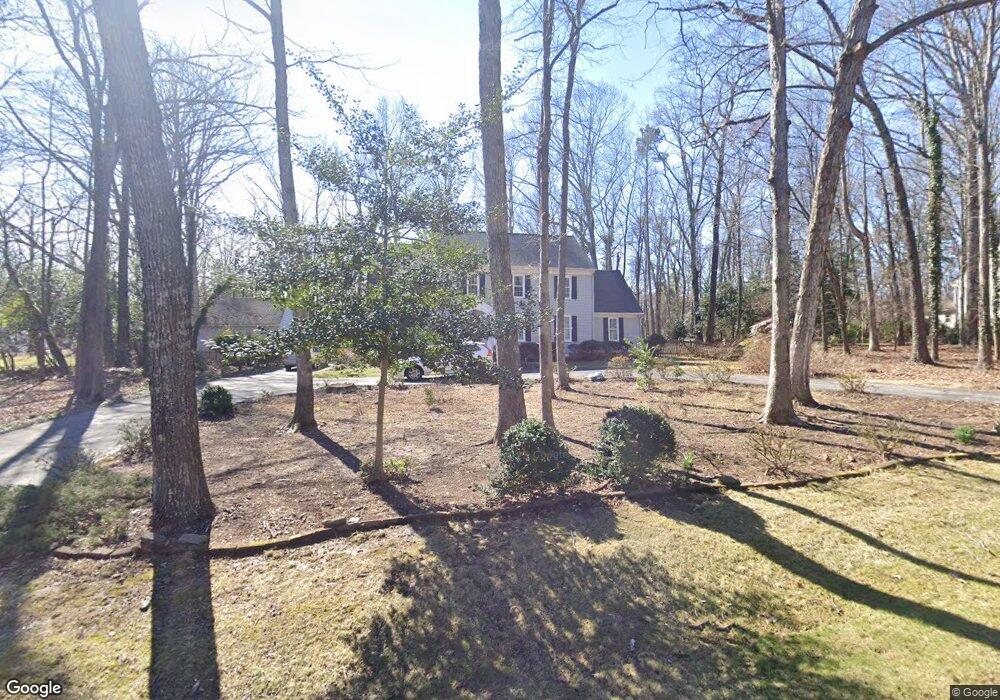
13511 Starcross Rd Midlothian, VA 23113
Salisbury NeighborhoodEstimated Value: $651,000 - $745,000
4
Beds
3
Baths
2,905
Sq Ft
$241/Sq Ft
Est. Value
About This Home
This home is located at 13511 Starcross Rd, Midlothian, VA 23113 and is currently estimated at $698,659, approximately $240 per square foot. 13511 Starcross Rd is a home located in Chesterfield County with nearby schools including Bettie Weaver Elementary School, Midlothian Middle School, and Midlothian High School.
Ownership History
Date
Name
Owned For
Owner Type
Purchase Details
Closed on
Mar 30, 2004
Sold by
Griffin Cerena
Bought by
Dry Robert
Current Estimated Value
Home Financials for this Owner
Home Financials are based on the most recent Mortgage that was taken out on this home.
Original Mortgage
$254,000
Outstanding Balance
$118,695
Interest Rate
5.56%
Mortgage Type
New Conventional
Estimated Equity
$579,964
Purchase Details
Closed on
May 18, 2001
Sold by
Bosetti Paul C
Bought by
Dry Robert F and Dry Sue A
Home Financials for this Owner
Home Financials are based on the most recent Mortgage that was taken out on this home.
Original Mortgage
$228,000
Interest Rate
7.03%
Mortgage Type
New Conventional
Purchase Details
Closed on
Mar 1, 1999
Sold by
Brooks George K
Bought by
Bosetti Paul C and Bosetti Pamela L
Home Financials for this Owner
Home Financials are based on the most recent Mortgage that was taken out on this home.
Original Mortgage
$166,000
Interest Rate
6.78%
Mortgage Type
New Conventional
Create a Home Valuation Report for This Property
The Home Valuation Report is an in-depth analysis detailing your home's value as well as a comparison with similar homes in the area
Home Values in the Area
Average Home Value in this Area
Purchase History
| Date | Buyer | Sale Price | Title Company |
|---|---|---|---|
| Dry Robert | $254,000 | -- | |
| Dry Robert F | $285,000 | -- | |
| Bosetti Paul C | $225,000 | -- |
Source: Public Records
Mortgage History
| Date | Status | Borrower | Loan Amount |
|---|---|---|---|
| Open | Dry Robert | $254,000 | |
| Previous Owner | Bosetti Paul C | $228,000 | |
| Previous Owner | Bosetti Paul C | $166,000 |
Source: Public Records
Tax History Compared to Growth
Tax History
| Year | Tax Paid | Tax Assessment Tax Assessment Total Assessment is a certain percentage of the fair market value that is determined by local assessors to be the total taxable value of land and additions on the property. | Land | Improvement |
|---|---|---|---|---|
| 2025 | $5,555 | $621,400 | $136,600 | $484,800 |
| 2024 | $5,555 | $596,700 | $123,600 | $473,100 |
| 2023 | $5,395 | $533,800 | $108,600 | $425,200 |
| 2022 | $4,682 | $508,900 | $105,600 | $403,300 |
| 2021 | $4,579 | $475,000 | $103,600 | $371,400 |
| 2020 | $4,378 | $460,800 | $103,600 | $357,200 |
| 2019 | $4,157 | $437,600 | $102,600 | $335,000 |
| 2018 | $4,142 | $436,000 | $101,000 | $335,000 |
| 2017 | $3,991 | $415,700 | $100,000 | $315,700 |
| 2016 | $3,946 | $411,000 | $96,000 | $315,000 |
| 2015 | $3,919 | $405,600 | $96,000 | $309,600 |
| 2014 | $3,755 | $388,500 | $96,000 | $292,500 |
Source: Public Records
Map
Nearby Homes
- 2303 Bream Dr
- 2360 Castlebridge Rd
- 2725 Stonegate Ct
- 2540 Kentford Rd
- 13449 Glendower Rd
- 14100 Worchester Ct
- 13901 Dunkeld Terrace
- 1480 Railroad Ave
- 14124 Rigney Dr
- 2735 Swanhurst Dr
- 1510 Sycamore Square Dr Unit 1510
- 12602 Foxstone Ct
- 3020 Mount Hill Dr
- 1320 Railroad Ave
- 12931 River Hills Dr
- 14000 Westfield Rd
- 14309 Michaux Springs Dr
- 1813 Gildenborough Ct
- 14110 Netherfield Dr
- 13637 Langford Dr
- 13521 Starcross Rd
- 13501 Starcross Rd
- 13532 Kingsmill Rd
- 13542 Kingsmill Rd
- 13522 Kingsmill Rd
- 13439 Starcross Rd
- 13516 Starcross Rd
- 13437 Starcross Rd
- 13500 Starcross Rd
- 13600 Kingsmill Rd
- 13510 Kingsmill Rd
- 13531 Starcross Rd
- 13500 Kingsmill Rd
- 13431 Starcross Rd
- 13536 Starcross Rd
- 13430 Starcross Rd
- 13440 Kingsmill Rd
- 13541 Kingsmill Rd
- 13601 Kingsmill Rd
- 13610 Kingsmill Rd