Estimated Value: $252,000 - $301,000
3
Beds
1
Bath
1,032
Sq Ft
$269/Sq Ft
Est. Value
About This Home
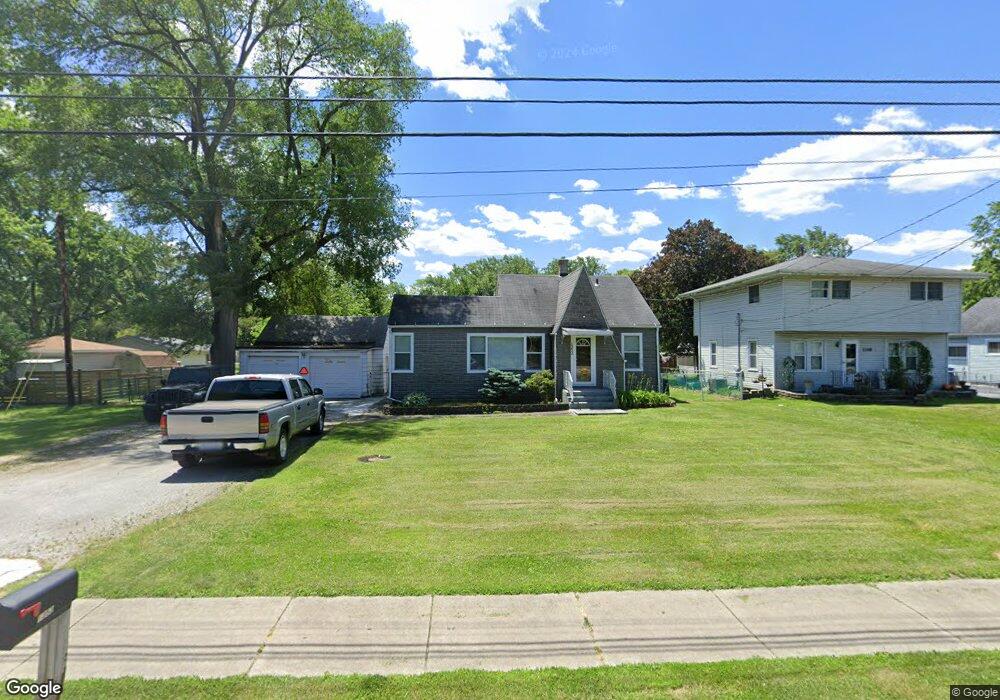
This home is located at 1352 213th St, Dyer, IN 46311 and is currently estimated at $277,156, approximately $268 per square foot. 1352 213th St is a home located in Lake County with nearby schools including Protsman Elementary School, Kahler Middle School, and Lake Central High School.
Ownership History
Date
Name
Owned For
Owner Type
Purchase Details
Closed on
Sep 10, 2012
Sold by
Rangel Laura J
Bought by
Rangel Carlos
Current Estimated Value
Purchase Details
Closed on
Jun 6, 2007
Sold by
Tomich Properties Llc
Bought by
Rangel Carlos and Rangel Laura J
Home Financials for this Owner
Home Financials are based on the most recent Mortgage that was taken out on this home.
Original Mortgage
$109,280
Interest Rate
6.21%
Mortgage Type
Purchase Money Mortgage
Purchase Details
Closed on
Jan 21, 2006
Sold by
Bantom Properties Llc
Bought by
Tomich Properties Llc
Purchase Details
Closed on
Jul 1, 2005
Sold by
Ljt Properties Llc
Bought by
Bantom Properties Llc and Ljt Properties Llc
Purchase Details
Closed on
Sep 20, 2004
Sold by
Tomich Jared J
Bought by
Ljt Properties Llc
Create a Home Valuation Report for This Property
The Home Valuation Report is an in-depth analysis detailing your home's value as well as a comparison with similar homes in the area
Home Values in the Area
Average Home Value in this Area
Purchase History
| Date | Buyer | Sale Price | Title Company |
|---|---|---|---|
| Rangel Carlos | -- | None Available | |
| Rangel Carlos | -- | Ticor Scher | |
| Tomich Properties Llc | -- | None Available | |
| Bantom Properties Llc | -- | -- | |
| Ljt Properties Llc | -- | -- |
Source: Public Records
Mortgage History
| Date | Status | Borrower | Loan Amount |
|---|---|---|---|
| Closed | Rangel Carlos | $109,280 |
Source: Public Records
Tax History
| Year | Tax Paid | Tax Assessment Tax Assessment Total Assessment is a certain percentage of the fair market value that is determined by local assessors to be the total taxable value of land and additions on the property. | Land | Improvement |
|---|---|---|---|---|
| 2025 | $1,754 | $232,500 | $47,100 | $185,400 |
| 2024 | $4,545 | $208,200 | $47,100 | $161,100 |
| 2023 | $1,730 | $178,700 | $47,100 | $131,600 |
| 2022 | $1,730 | $166,500 | $47,100 | $119,400 |
| 2021 | $1,626 | $161,900 | $47,100 | $114,800 |
| 2020 | $1,641 | $159,500 | $33,300 | $126,200 |
| 2019 | $1,867 | $168,700 | $22,800 | $145,900 |
| 2018 | $1,746 | $165,000 | $22,800 | $142,200 |
| 2017 | $1,386 | $147,500 | $22,800 | $124,700 |
| 2016 | $1,214 | $133,700 | $22,800 | $110,900 |
| 2014 | $1,057 | $128,600 | $18,000 | $110,600 |
| 2013 | $1,032 | $125,600 | $18,000 | $107,600 |
Source: Public Records
Map
Nearby Homes
- 1310 Ludington Ln
- 955 Killarney Dr
- 1390 Mackinaw Place
- 821 Grand Haven Way
- 917 Perthshire Ln
- 1224 Muirfield Dr
- 1741 Springtime Ct
- 811 Royal Dublin Ln
- 1141 Portmarnock Ct
- 828 Royal Dublin Ln
- T-1415 Adler Plan at Parkside
- 6208 Lakewood Ave
- T-1647 Wren Plan at Parkside
- 1025 Windsor Ln
- 1039 Summertime Ct
- 1224 Lily Ln
- 1273 Bluebell Trail
- 1023 Kensington Ct
- 748 Wellington Dr
- 1114 Barrington Ct
- 1348 213th St
- 1344 213th St
- 1308 Greenwood Ave
- 1304 Greenwood Ave
- 1340 213th St
- 1314 Greenwood Ave
- 1318 Greenwood Ave
- 1334 213th St
- 1324 Greenwood Ave
- 1328 Greenwood Ave
- 1416 213th St
- 1251 Killarney Dr
- 1415 E End Ave
- 1332 Greenwood Ave
- 1318 213th St
- 1421 E End Ave
- 1245 Killarney Dr
- 1424 213th St
- 1338 Greenwood Ave
- 1416 E End Ave
Your Personal Tour Guide
Ask me questions while you tour the home.