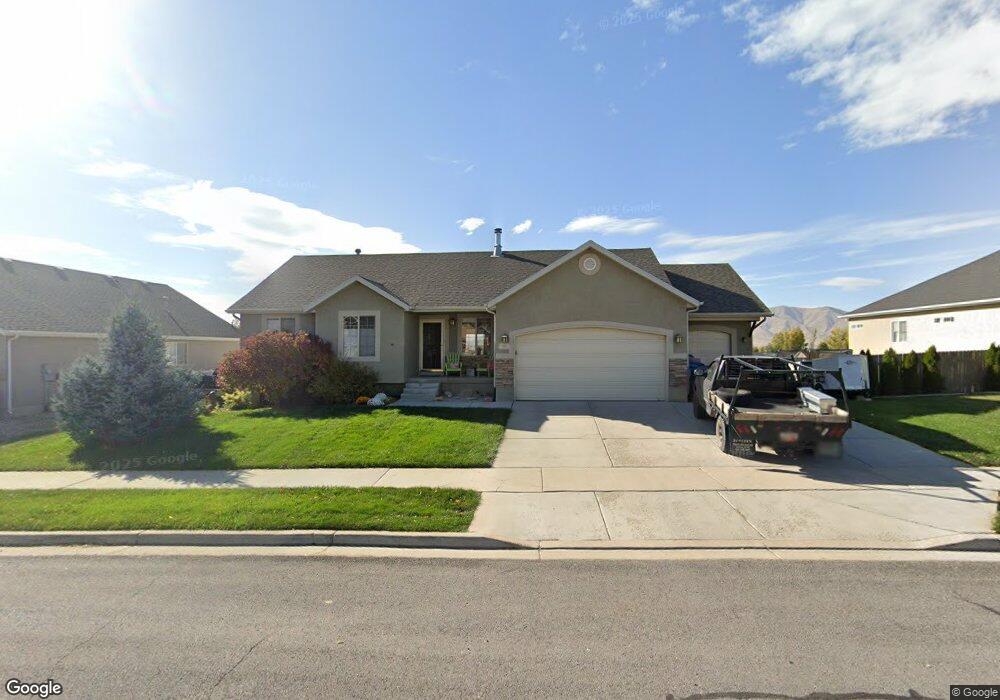
1352 S 300 W Payson, UT 84651
Estimated Value: $481,000 - $519,494
3
Beds
2
Baths
1,256
Sq Ft
$396/Sq Ft
Est. Value
About This Home
This home is located at 1352 S 300 W, Payson, UT 84651 and is currently estimated at $497,498, approximately $396 per square foot. 1352 S 300 W is a home located in Utah County with nearby schools including Spring Lake Elementary, Payson High School, and Payson Junior High School.
Ownership History
Date
Name
Owned For
Owner Type
Purchase Details
Closed on
Nov 11, 2014
Sold by
Armitage Thomas P and Armitage Brenda L
Bought by
Thomas P Armitage Trust
Current Estimated Value
Purchase Details
Closed on
Jun 3, 2005
Sold by
Salisbury Development Lc
Bought by
Armitage Thomas P and Armitage Brenda L
Home Financials for this Owner
Home Financials are based on the most recent Mortgage that was taken out on this home.
Original Mortgage
$135,200
Outstanding Balance
$70,492
Interest Rate
5.74%
Mortgage Type
Fannie Mae Freddie Mac
Estimated Equity
$427,006
Purchase Details
Closed on
Jan 15, 2004
Sold by
Bws Payson Properties Llc
Bought by
Salisbury Development L C
Create a Home Valuation Report for This Property
The Home Valuation Report is an in-depth analysis detailing your home's value as well as a comparison with similar homes in the area
Home Values in the Area
Average Home Value in this Area
Purchase History
| Date | Buyer | Sale Price | Title Company |
|---|---|---|---|
| Thomas P Armitage Trust | -- | None Available | |
| Armitage Thomas P | -- | Provo Land Title Co | |
| Salisbury Development L C | -- | Affiliated First Title Comp |
Source: Public Records
Mortgage History
| Date | Status | Borrower | Loan Amount |
|---|---|---|---|
| Open | Armitage Thomas P | $135,200 |
Source: Public Records
Tax History
| Year | Tax Paid | Tax Assessment Tax Assessment Total Assessment is a certain percentage of the fair market value that is determined by local assessors to be the total taxable value of land and additions on the property. | Land | Improvement |
|---|---|---|---|---|
| 2025 | $478 | $269,775 | -- | -- |
| 2024 | $478 | $244,860 | $0 | $0 |
| 2023 | $271 | $246,180 | $0 | $0 |
| 2022 | $784 | $243,265 | $0 | $0 |
| 2021 | $1,996 | $329,500 | $117,400 | $212,100 |
| 2020 | $1,938 | $305,300 | $106,700 | $198,600 |
| 2019 | $1,777 | $286,900 | $88,300 | $198,600 |
| 2018 | $1,649 | $256,600 | $77,300 | $179,300 |
| 2017 | $1,521 | $127,325 | $0 | $0 |
| 2016 | $1,445 | $120,120 | $0 | $0 |
| 2015 | $1,303 | $107,580 | $0 | $0 |
| 2014 | $1,148 | $95,480 | $0 | $0 |
Source: Public Records
Map
Nearby Homes
- 582 E 1250 S Unit 137
- 609 W Saddlebrook Dr
- 1163 S 730 W
- 613 Saddlebrook Dr
- 336 E 1330 S
- 802 Brookside Ct
- 1631 S Highway 198
- 245 W 1770 S
- 1835 S 410 W
- 288 E 900 S
- 1848 S 100 E Unit 3
- 1468 S 910 W
- 1632 S 240 W Unit 47
- 1652 S 240 W Unit 48
- 1172 S 880 W
- 1589 S 840 W
- 876 Greenridge Ave
- 1872 S 100 E Unit 6
- 1320 S 950 W
- 991 S 930 W
Your Personal Tour Guide
Ask me questions while you tour the home.