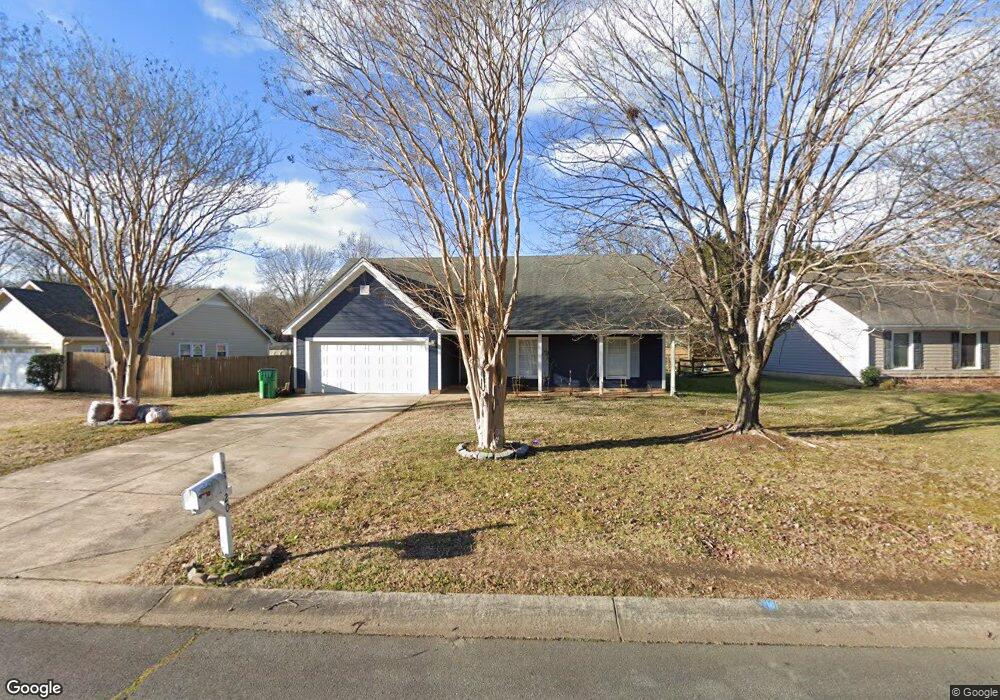
13520 Thicket Ct Unit 32 Charlotte, NC 28273
Yorkshire NeighborhoodEstimated Value: $351,000 - $372,000
3
Beds
2
Baths
1,585
Sq Ft
$228/Sq Ft
Est. Value
About This Home
This home is located at 13520 Thicket Ct Unit 32, Charlotte, NC 28273 and is currently estimated at $361,858, approximately $228 per square foot. 13520 Thicket Ct Unit 32 is a home located in Mecklenburg County with nearby schools including River Gate Elementary, Southwest Middle School, and Unity Classical Charter School.
Ownership History
Date
Name
Owned For
Owner Type
Purchase Details
Closed on
Dec 7, 2020
Sold by
Smith Nancy M
Bought by
Maldonado Carlos A Sanabria and Guevara Edyth Dejesus
Current Estimated Value
Home Financials for this Owner
Home Financials are based on the most recent Mortgage that was taken out on this home.
Original Mortgage
$225,834
Outstanding Balance
$201,418
Interest Rate
2.8%
Mortgage Type
FHA
Estimated Equity
$160,440
Purchase Details
Closed on
Sep 16, 2020
Sold by
Smith Steven H
Bought by
Smith Nancy M
Purchase Details
Closed on
Aug 22, 2001
Sold by
Berger Patrick Steven and Berger Camilla Ritchie
Bought by
Smith Steven H and Smith Nancy M
Home Financials for this Owner
Home Financials are based on the most recent Mortgage that was taken out on this home.
Original Mortgage
$131,840
Interest Rate
7.08%
Mortgage Type
Purchase Money Mortgage
Create a Home Valuation Report for This Property
The Home Valuation Report is an in-depth analysis detailing your home's value as well as a comparison with similar homes in the area
Home Values in the Area
Average Home Value in this Area
Purchase History
| Date | Buyer | Sale Price | Title Company |
|---|---|---|---|
| Maldonado Carlos A Sanabria | $230,000 | None Available | |
| Smith Nancy M | -- | None Available | |
| Smith Steven H | $128,000 | -- |
Source: Public Records
Mortgage History
| Date | Status | Borrower | Loan Amount |
|---|---|---|---|
| Open | Maldonado Carlos A Sanabria | $225,834 | |
| Previous Owner | Smith Steven H | $131,840 |
Source: Public Records
Tax History Compared to Growth
Tax History
| Year | Tax Paid | Tax Assessment Tax Assessment Total Assessment is a certain percentage of the fair market value that is determined by local assessors to be the total taxable value of land and additions on the property. | Land | Improvement |
|---|---|---|---|---|
| 2025 | $2,617 | $325,300 | $90,000 | $235,300 |
| 2024 | $2,617 | $325,300 | $90,000 | $235,300 |
| 2023 | $2,525 | $325,300 | $90,000 | $235,300 |
| 2022 | $2,224 | $217,500 | $55,000 | $162,500 |
| 2021 | $2,213 | $217,500 | $55,000 | $162,500 |
| 2020 | $2,206 | $217,500 | $55,000 | $162,500 |
| 2019 | $2,190 | $217,500 | $55,000 | $162,500 |
| 2018 | $2,035 | $149,500 | $31,500 | $118,000 |
| 2017 | $1,998 | $149,500 | $31,500 | $118,000 |
| 2016 | $1,989 | $149,500 | $31,500 | $118,000 |
| 2015 | $1,977 | $149,500 | $31,500 | $118,000 |
| 2014 | $1,982 | $149,500 | $31,500 | $118,000 |
Source: Public Records
Map
Nearby Homes
- 13506 Stephendale Dr
- 13309 Lampmeade Ln
- 13308 Bolingbrook Ln
- 13233 Lampmeade Ln
- 11929 Tanton Ln
- 13421 Bolingbrook Ln
- 13441 Calloway Glen Dr
- 13462 Calloway Glen Dr
- 11802 Woffington Ct
- 13377 Calloway Glen Dr
- 13617 Merton Woods Ln
- 13116 Erwin Rd
- 12918 Mosby Ln
- 12772 Persimmon Tree Dr
- 12731 Persimmon Tree Dr
- 11320 Wagonford Ln
- 14640 Lions Paw St
- 13310 Erwin Rd
- 13505 Walkers Creek Dr
- 13648 Meade Glen Ct
- 13520 Thicket Ct
- 13528 Thicket Ct
- 13512 Thicket Ct
- 12140 Stainsby Ln
- 13506 Thicket Ct
- 13506 Thicket Ct Unit 30
- 12134 Stainsby Ln
- 12108 Stainsby Ln
- 12144 Stainsby Ln
- 12116 Stainsby Ln
- 13517 Thicket Ct
- 13527 Thicket Ct
- 12126 Stainsby Ln
- 13511 Thicket Ct
- 13533 Thicket Ct
- 13500 Thicket Ct
- 13505 Thicket Ct
- 13541 Thicket Ct
- 12148 Stainsby Ln
- 12026 Lazy Willow Ln