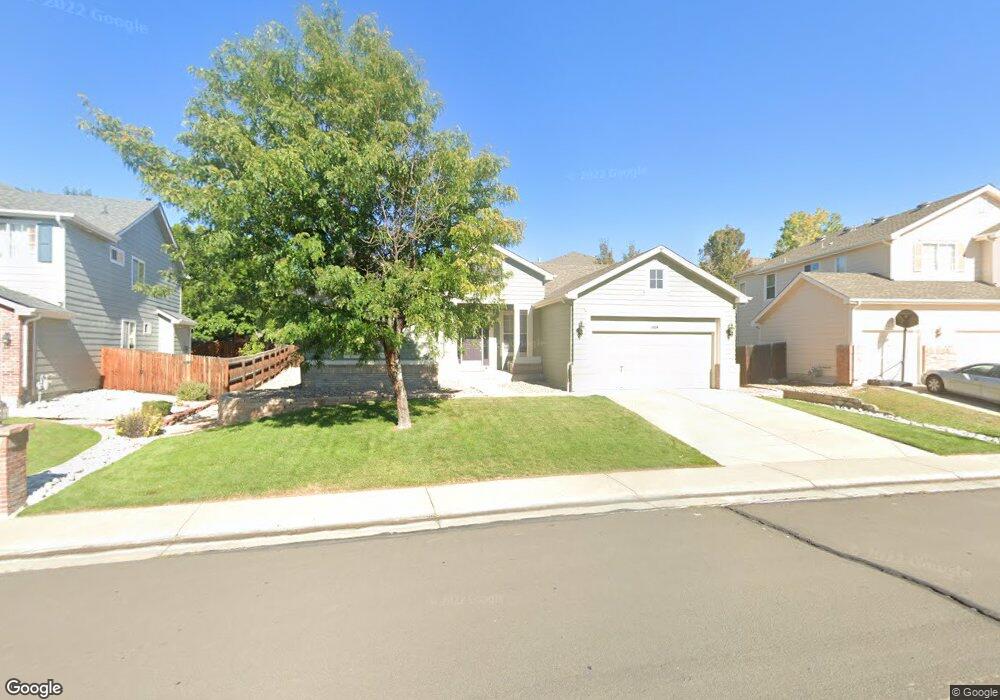
13524 Clayton St Thornton, CO 80241
Signal Creek NeighborhoodEstimated Value: $608,079 - $681,000
2
Beds
2
Baths
2,096
Sq Ft
$309/Sq Ft
Est. Value
About This Home
This home is located at 13524 Clayton St, Thornton, CO 80241 and is currently estimated at $648,270, approximately $309 per square foot. 13524 Clayton St is a home located in Adams County with nearby schools including Tarver Elementary School, Century Middle School, and Horizon High School.
Ownership History
Date
Name
Owned For
Owner Type
Purchase Details
Closed on
Jul 17, 2025
Sold by
Kaemingk Leslie A and Kaemingk Les A
Bought by
Kaemingk Leslie A and Kaemingk Lura N
Current Estimated Value
Home Financials for this Owner
Home Financials are based on the most recent Mortgage that was taken out on this home.
Original Mortgage
$1,032,000
Outstanding Balance
$994,689
Interest Rate
3.8%
Mortgage Type
Reverse Mortgage Home Equity Conversion Mortgage
Estimated Equity
-$346,419
Purchase Details
Closed on
Sep 27, 2001
Sold by
Thomas William J
Bought by
Kaemingk Les A and Kaemingk Nelldean W
Home Financials for this Owner
Home Financials are based on the most recent Mortgage that was taken out on this home.
Original Mortgage
$293,250
Interest Rate
6.88%
Mortgage Type
Construction
Purchase Details
Closed on
Jul 28, 2000
Sold by
Village Homes Of Colorado Inc
Bought by
Thomas William J
Home Financials for this Owner
Home Financials are based on the most recent Mortgage that was taken out on this home.
Original Mortgage
$225,000
Interest Rate
8.15%
Create a Home Valuation Report for This Property
The Home Valuation Report is an in-depth analysis detailing your home's value as well as a comparison with similar homes in the area
Home Values in the Area
Average Home Value in this Area
Purchase History
| Date | Buyer | Sale Price | Title Company |
|---|---|---|---|
| Kaemingk Leslie A | -- | Titlemax | |
| Kaemingk Les A | $265,000 | -- | |
| Thomas William J | $283,625 | Land Title Guarantee Company |
Source: Public Records
Mortgage History
| Date | Status | Borrower | Loan Amount |
|---|---|---|---|
| Open | Kaemingk Leslie A | $1,032,000 | |
| Closed | Kaemingk Leslie A | $1,032,000 | |
| Previous Owner | Kaemingk Les A | $293,250 | |
| Previous Owner | Thomas William J | $225,000 |
Source: Public Records
Tax History Compared to Growth
Tax History
| Year | Tax Paid | Tax Assessment Tax Assessment Total Assessment is a certain percentage of the fair market value that is determined by local assessors to be the total taxable value of land and additions on the property. | Land | Improvement |
|---|---|---|---|---|
| 2024 | $3,480 | $39,260 | $8,130 | $31,130 |
| 2023 | $3,445 | $44,110 | $8,390 | $35,720 |
| 2022 | $2,817 | $32,520 | $8,620 | $23,900 |
| 2021 | $2,910 | $32,520 | $8,620 | $23,900 |
| 2020 | $2,932 | $33,430 | $8,870 | $24,560 |
| 2019 | $2,938 | $33,430 | $8,870 | $24,560 |
| 2018 | $2,757 | $31,160 | $7,200 | $23,960 |
| 2017 | $2,507 | $31,160 | $7,200 | $23,960 |
| 2016 | $2,255 | $28,940 | $5,890 | $23,050 |
| 2015 | $2,251 | $20,980 | $4,270 | $16,710 |
| 2014 | $2,219 | $20,110 | $3,880 | $16,230 |
Source: Public Records
Map
Nearby Homes
- 13540 Detroit St
- 3022 E 137th Place
- 2788 E 132nd Cir
- 2746 E 132nd Place
- 2691 E 132nd Ave
- 13758 Cook St
- 13606 Garfield St Unit E
- 13398 Race St
- 13845 Adams Cir
- 13638 Garfield St Unit C
- 4061 E 133rd Cir
- 0 Colorado Blvd
- 13890 Madison St
- 13080 Harrison Dr
- 13844 Jackson St
- 13068 Harrison Dr
- 13064 Harrison Dr
- 2275 E 129th Ave
- 3825 Dyanna Dr
- 12811 Josephine Ct
- 13526 Clayton St
- 13522 Clayton St
- 13557 Detroit St
- 13555 Detroit St
- 13559 Detroit St
- 13553 Detroit St
- 13528 Clayton St
- 13525 Clayton St
- 13527 Clayton St
- 13563 Detroit St
- 13498 Clayton St
- 13532 Clayton St
- 13529 Clayton St
- 13549 Detroit St
- 13495 Clayton St
- 13565 Detroit St
- 13492 Clayton St
- 13556 Detroit St
- 13558 Detroit St
- 13533 Clayton St