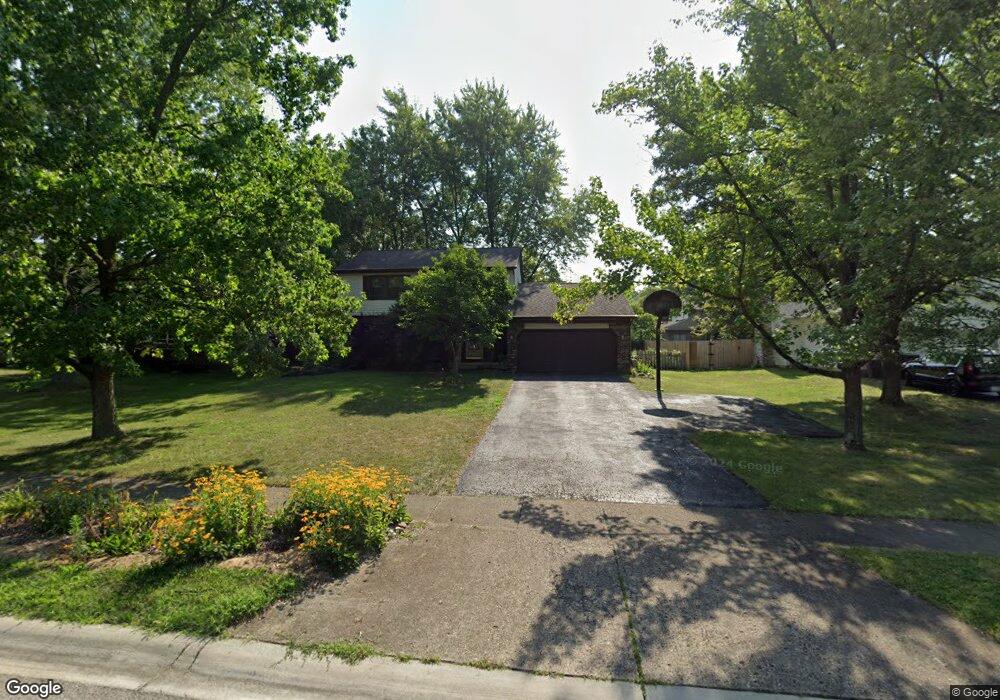
13526 Capetown Ave Pickerington, OH 43147
Estimated Value: $347,919 - $370,000
3
Beds
4
Baths
1,902
Sq Ft
$190/Sq Ft
Est. Value
About This Home
This home is located at 13526 Capetown Ave, Pickerington, OH 43147 and is currently estimated at $360,730, approximately $189 per square foot. 13526 Capetown Ave is a home located in Fairfield County with nearby schools including Fairfield Elementary School, Harmon Middle School, and Pickerington Lakeview Junior High School.
Ownership History
Date
Name
Owned For
Owner Type
Purchase Details
Closed on
Oct 1, 2007
Sold by
Homecomings Financial Llc
Bought by
Arps Michael D and Arps Sharon M
Current Estimated Value
Home Financials for this Owner
Home Financials are based on the most recent Mortgage that was taken out on this home.
Original Mortgage
$125,600
Outstanding Balance
$78,901
Interest Rate
6.33%
Mortgage Type
Purchase Money Mortgage
Estimated Equity
$281,829
Purchase Details
Closed on
Mar 23, 2007
Sold by
Barber Donald L and Barber Jyl L
Bought by
Homecomings Financial Llc
Purchase Details
Closed on
Aug 16, 1999
Sold by
Ballard Dottie J
Bought by
Barber Donald L and Barber Jyl L
Home Financials for this Owner
Home Financials are based on the most recent Mortgage that was taken out on this home.
Original Mortgage
$118,320
Interest Rate
8%
Mortgage Type
New Conventional
Purchase Details
Closed on
Jun 1, 1986
Create a Home Valuation Report for This Property
The Home Valuation Report is an in-depth analysis detailing your home's value as well as a comparison with similar homes in the area
Home Values in the Area
Average Home Value in this Area
Purchase History
| Date | Buyer | Sale Price | Title Company |
|---|---|---|---|
| Arps Michael D | $157,000 | Sovereign Title Agency Llc | |
| Homecomings Financial Llc | $140,860 | None Available | |
| Barber Donald L | $147,900 | -- | |
| -- | $89,900 | -- |
Source: Public Records
Mortgage History
| Date | Status | Borrower | Loan Amount |
|---|---|---|---|
| Open | Arps Michael D | $125,600 | |
| Previous Owner | Barber Donald L | $118,320 |
Source: Public Records
Tax History Compared to Growth
Tax History
| Year | Tax Paid | Tax Assessment Tax Assessment Total Assessment is a certain percentage of the fair market value that is determined by local assessors to be the total taxable value of land and additions on the property. | Land | Improvement |
|---|---|---|---|---|
| 2024 | $10,728 | $90,530 | $14,510 | $76,020 |
| 2023 | $4,119 | $90,530 | $14,510 | $76,020 |
| 2022 | $4,131 | $90,530 | $14,510 | $76,020 |
| 2021 | $3,548 | $66,220 | $14,510 | $51,710 |
| 2020 | $3,586 | $66,220 | $14,510 | $51,710 |
| 2019 | $3,609 | $66,220 | $14,510 | $51,710 |
| 2018 | $3,348 | $51,730 | $14,210 | $37,520 |
| 2017 | $3,357 | $53,720 | $13,370 | $40,350 |
| 2016 | $3,338 | $53,720 | $13,370 | $40,350 |
| 2015 | $3,136 | $48,900 | $10,280 | $38,620 |
| 2014 | $3,095 | $48,900 | $10,280 | $38,620 |
| 2013 | $3,095 | $48,900 | $10,280 | $38,620 |
Source: Public Records
Map
Nearby Homes
- 13115 Morrison Place
- 13137 E Crosset Hill Dr
- 13068 Rustic Dr
- 13070 E Crosset Hill Dr
- 7933 Meadowlark Ln S Unit 7933
- 9756 Camelot St NW
- 9538 Timberbank Cir
- 2098 Stone Valley Place
- 13048 Coventry Ave
- 7780 Featherleaf Ct
- 7700 Eagle Creek Dr
- 7659 Howell Park Dr
- 1960 Haverton Dr
- 2900 Torrey Pines Dr
- 2888 Torrey Pines Dr
- 1890 Lockmere Ct
- 7553 Bay Hill Dr
- 3077 Highland Park Dr
- 2961 Stone Mountain Dr
- 7640 Kittansett Ln
- 13540 Capetown Ave
- 13512 Capetown Ave
- 13521 Falmouth Ave
- 13554 Capetown Ave
- 13535 Falmouth Ave
- 13496 Capetown Ave
- 13505 Falmouth Ave
- 13531 Capetown Ave
- 13549 Falmouth Ave
- 13495 Falmouth Ave
- 13545 Capetown Ave
- 13568 Capetown Ave
- 13480 Capetown Ave
- 13563 Falmouth Ave
- 13559 Capetown Ave
- 13477 Falmouth Ave
- 13485 Capetown Ave
- 13464 Capetown Ave
- 13573 Capetown Ave
- 13528 Falmouth Ave