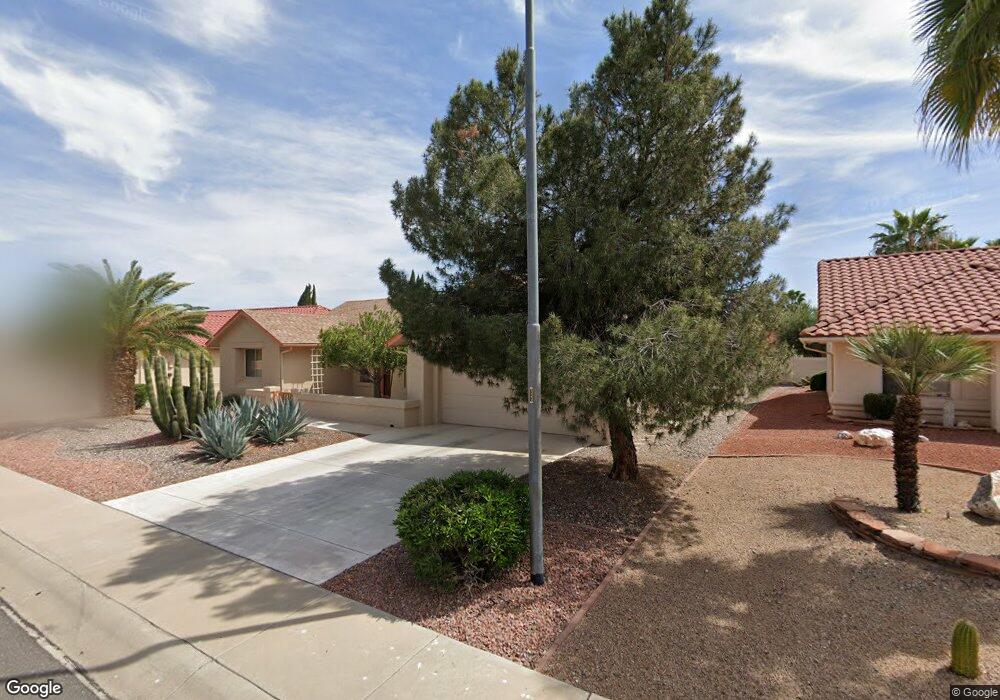
13529 W Pavillion Dr Sun City West, AZ 85375
Estimated Value: $273,872 - $336,000
--
Bed
2
Baths
1,085
Sq Ft
$284/Sq Ft
Est. Value
About This Home
This home is located at 13529 W Pavillion Dr, Sun City West, AZ 85375 and is currently estimated at $308,468, approximately $284 per square foot. 13529 W Pavillion Dr is a home located in Maricopa County with nearby schools including FourteenSix Christian Academy.
Ownership History
Date
Name
Owned For
Owner Type
Purchase Details
Closed on
Jan 12, 2023
Sold by
Peterson John H
Bought by
Peterson James E
Current Estimated Value
Purchase Details
Closed on
Nov 25, 2020
Sold by
Peterson Lorriane N
Bought by
Peterson Lorriane N and Peterson John H
Purchase Details
Closed on
May 18, 2000
Sold by
Kust Karen B
Bought by
Peterson Lorraine N
Purchase Details
Closed on
May 7, 1998
Sold by
May Dorothy J
Bought by
Kust Karen B
Home Financials for this Owner
Home Financials are based on the most recent Mortgage that was taken out on this home.
Original Mortgage
$65,000
Interest Rate
7.11%
Mortgage Type
New Conventional
Purchase Details
Closed on
Feb 16, 1995
Sold by
Seymour George T and Seymour Angelina
Bought by
May Dorothy J
Purchase Details
Closed on
Jan 13, 1995
Sold by
Anderson Jacob F and Anderson Shirley M
Bought by
Seymour George T and Seymour Angelina
Create a Home Valuation Report for This Property
The Home Valuation Report is an in-depth analysis detailing your home's value as well as a comparison with similar homes in the area
Home Values in the Area
Average Home Value in this Area
Purchase History
| Date | Buyer | Sale Price | Title Company |
|---|---|---|---|
| Peterson James E | -- | Professional Escrow Resources | |
| Peterson Lorriane N | -- | New Title Company Name | |
| Peterson Lorraine N | $113,500 | Capital Title Agency | |
| Kust Karen B | $114,000 | First American Title | |
| May Dorothy J | $116,000 | First American Title | |
| Seymour George T | $110,000 | First American Title |
Source: Public Records
Mortgage History
| Date | Status | Borrower | Loan Amount |
|---|---|---|---|
| Previous Owner | Kust Karen B | $65,000 |
Source: Public Records
Tax History Compared to Growth
Tax History
| Year | Tax Paid | Tax Assessment Tax Assessment Total Assessment is a certain percentage of the fair market value that is determined by local assessors to be the total taxable value of land and additions on the property. | Land | Improvement |
|---|---|---|---|---|
| 2025 | $1,131 | $14,062 | -- | -- |
| 2024 | $1,112 | $13,392 | -- | -- |
| 2023 | $1,112 | $22,460 | $4,490 | $17,970 |
| 2022 | $1,047 | $18,130 | $3,620 | $14,510 |
| 2021 | $975 | $16,370 | $3,270 | $13,100 |
| 2020 | $951 | $15,080 | $3,010 | $12,070 |
| 2019 | $931 | $13,200 | $2,640 | $10,560 |
| 2018 | $896 | $12,280 | $2,450 | $9,830 |
| 2017 | $862 | $11,510 | $2,300 | $9,210 |
| 2016 | $506 | $10,700 | $2,140 | $8,560 |
| 2015 | $792 | $9,630 | $1,920 | $7,710 |
Source: Public Records
Map
Nearby Homes
- 13451 W Ballad Dr
- 13447 W Ballad Dr
- 13547 W Sky Hawk Dr
- 13709 W Whitewood Dr
- 13450 W Stardust Blvd Unit 20A
- 21627 N 139th Dr
- 22120 N Golf Club Dr
- 13718 W Gable Hill Dr
- 13711 W Gable Hill Dr
- 22110 N Lobo Ln
- 14010 W Pavillion Dr
- 13725 W Springdale Dr
- 22318 N Dusty Trail Blvd Unit 51
- 22216 N Cheyenne Dr
- 13306 W Ballad Dr
- 14102 W Whitewood Dr
- 13417 W La Vina Dr
- 14117 W Pecos Ln
- 13819 W Elmbrook Dr
- 14133 W Vía Montoya
- 13533 W Pavillion Dr
- 13525 W Pavillion Dr
- 13530 W Ballad Dr
- 13534 W Ballad Dr
- 13537 W Pavillion Dr
- 13526 W Ballad Dr
- 13538 W Ballad Dr
- 13528 W Pavillion Dr
- 13524 W Pavillion Dr
- 13541 W Pavillion Dr
- 13542 W Ballad Dr Unit 39
- 13508 W Pavillion Dr
- 13512 W Pavillion Dr
- 13520 W Pavillion Dr
- 13531 W Ballad Dr
- 13504 W Pavillion Dr
- 13535 W Ballad Dr
- 13527 W Ballad Dr Unit 39
- 13545 W Pavillion Dr
- 13546 W Ballad Dr Unit 39