1353 16th St Mitchell, NE 69357
Estimated Value: $213,000 - $260,949
3
Beds
2
Baths
1,554
Sq Ft
$150/Sq Ft
Est. Value
About This Home
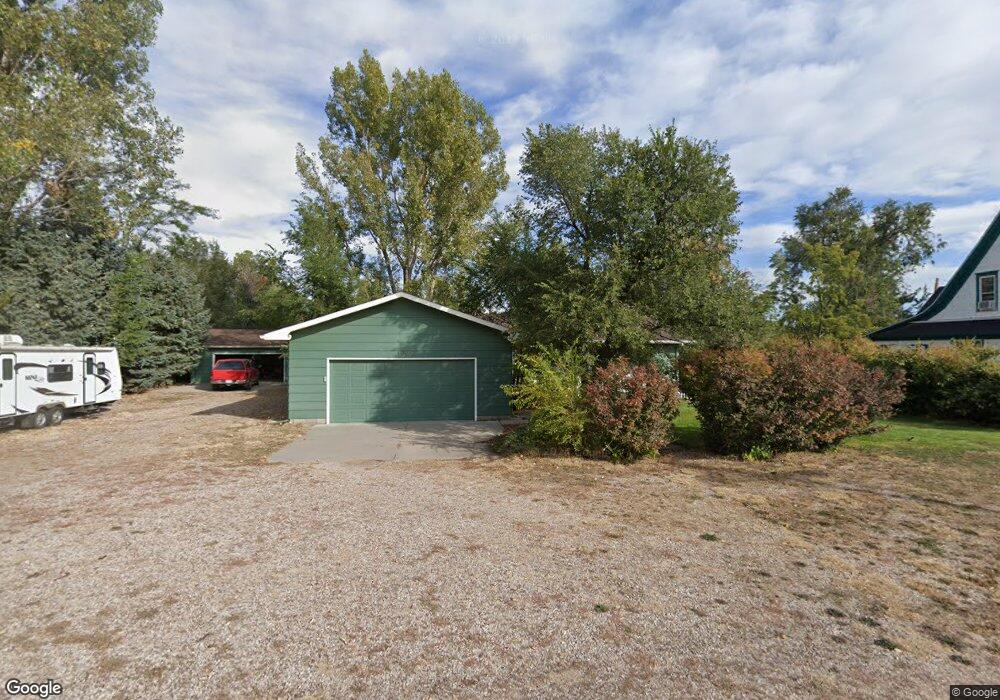
This home is located at 1353 16th St, Mitchell, NE 69357 and is currently estimated at $232,737, approximately $149 per square foot. 1353 16th St is a home located in Scotts Bluff County with nearby schools including Mitchell Elementary School and Mitchell Secondary School.
Ownership History
Date
Name
Owned For
Owner Type
Purchase Details
Closed on
Jul 28, 2015
Sold by
Tuttle Eric and Tuttle Katherine
Bought by
Baker James and Baker Ruby
Current Estimated Value
Purchase Details
Closed on
Nov 16, 2010
Sold by
Derr Rosie
Bought by
Tuttle Eric and Tuttle Katherine
Home Financials for this Owner
Home Financials are based on the most recent Mortgage that was taken out on this home.
Original Mortgage
$13,875
Interest Rate
4.24%
Mortgage Type
Future Advance Clause Open End Mortgage
Purchase Details
Closed on
Apr 9, 2009
Sold by
Plumlee Almena Faye
Bought by
Heimbouch Katherine Grace
Home Financials for this Owner
Home Financials are based on the most recent Mortgage that was taken out on this home.
Original Mortgage
$122,400
Interest Rate
5.16%
Mortgage Type
New Conventional
Create a Home Valuation Report for This Property
The Home Valuation Report is an in-depth analysis detailing your home's value as well as a comparison with similar homes in the area
Purchase History
| Date | Buyer | Sale Price | Title Company |
|---|---|---|---|
| Baker James | $132,000 | None Available | |
| Tuttle Eric | $19,000 | -- | |
| Heimbouch Katherine Grace | $120,000 | -- |
Source: Public Records
Mortgage History
| Date | Status | Borrower | Loan Amount |
|---|---|---|---|
| Previous Owner | Tuttle Eric | $13,875 | |
| Previous Owner | Heimbouch Katherine Grace | $122,400 |
Source: Public Records
Tax History
| Year | Tax Paid | Tax Assessment Tax Assessment Total Assessment is a certain percentage of the fair market value that is determined by local assessors to be the total taxable value of land and additions on the property. | Land | Improvement |
|---|---|---|---|---|
| 2025 | $3,136 | $244,625 | $33,200 | $211,425 |
| 2024 | $3,276 | $244,625 | $33,200 | $211,425 |
| 2023 | $3,645 | $188,144 | $8,510 | $179,634 |
| 2022 | $3,645 | $188,144 | $8,510 | $179,634 |
| 2021 | $3,377 | $167,478 | $8,510 | $158,968 |
| 2020 | $3,244 | $158,480 | $8,510 | $149,970 |
| 2019 | $3,236 | $158,480 | $8,510 | $149,970 |
| 2018 | $3,162 | $152,712 | $8,510 | $144,202 |
| 2017 | $2,995 | $143,278 | $8,510 | $134,768 |
| 2016 | $2,995 | $143,278 | $8,510 | $134,768 |
| 2015 | $2,908 | $143,278 | $8,510 | $134,768 |
| 2014 | $2,940 | $143,278 | $8,510 | $134,768 |
| 2012 | -- | $136,860 | $8,510 | $128,350 |
Source: Public Records
Map
Nearby Homes
- 1421 Broadway St
- 1538 17th St
- 1803 Broadway St
- 1803 21st St
- 1712 22nd Ave
- 50160 Hilyard Dr
- 50090 Partridge Dr
- CR K Cr 31
- TBD Highway 29
- 150265 Cr F
- 120793 Cr E
- 120568 Cr H
- 0 County Road A
- Legacy Feeders Unit LLC
- 100199 Cr 15
- 100199 County Road 15
- 50501 County Road 20
- 100568 Cr 14
- 90681 Kelley Rd
- 180436 River Rd
Your Personal Tour Guide
Ask me questions while you tour the home.