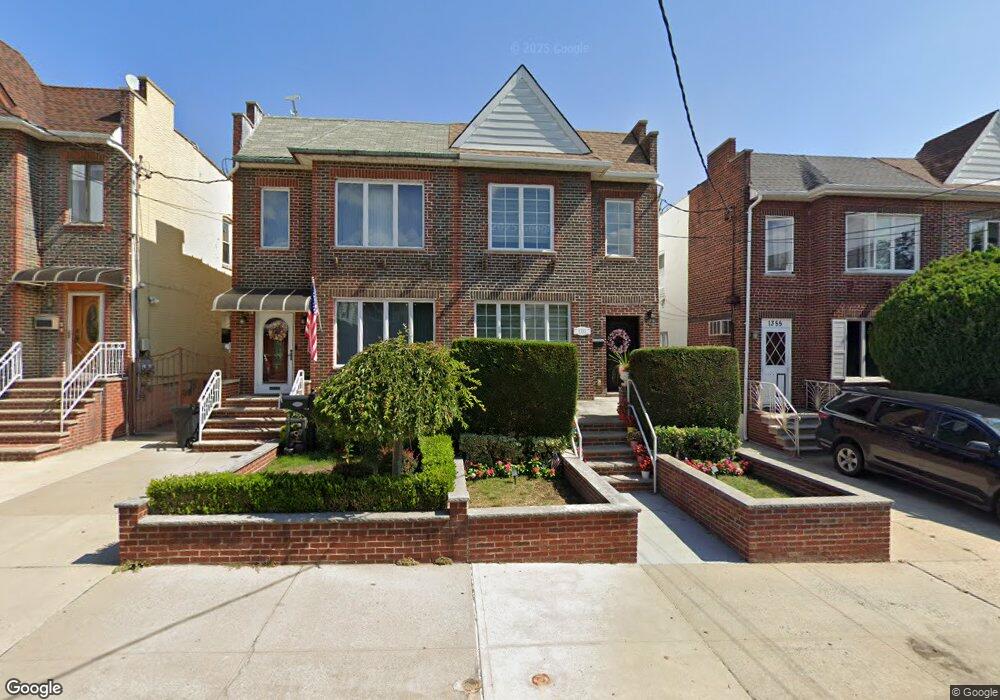
1353 80th St Brooklyn, NY 11228
Dyker Heights NeighborhoodEstimated Value: $1,140,000 - $1,227,000
Studio
--
Bath
1,404
Sq Ft
$848/Sq Ft
Est. Value
About This Home
This home is located at 1353 80th St, Brooklyn, NY 11228 and is currently estimated at $1,190,511, approximately $847 per square foot. 1353 80th St is a home located in Kings County with nearby schools including P.S. 204 Vince Lombardi, IS 201 Madeleine Brennan Intermediate School, and New Utrecht High School.
Ownership History
Date
Name
Owned For
Owner Type
Purchase Details
Closed on
Sep 28, 2009
Sold by
Megna Joseph
Bought by
Repole Andrea G and Repole Michael A
Current Estimated Value
Home Financials for this Owner
Home Financials are based on the most recent Mortgage that was taken out on this home.
Original Mortgage
$445,054
Outstanding Balance
$288,842
Interest Rate
5.12%
Mortgage Type
Purchase Money Mortgage
Estimated Equity
$901,669
Purchase Details
Closed on
Nov 30, 1999
Sold by
Megna Anna
Bought by
Megna Joseph
Create a Home Valuation Report for This Property
The Home Valuation Report is an in-depth analysis detailing your home's value as well as a comparison with similar homes in the area
Home Values in the Area
Average Home Value in this Area
Purchase History
| Date | Buyer | Sale Price | Title Company |
|---|---|---|---|
| Repole Andrea G | $486,000 | -- | |
| Repole Andrea G | $486,000 | -- | |
| Megna Joseph | -- | Stewart Title | |
| Megna Joseph | -- | Stewart Title |
Source: Public Records
Mortgage History
| Date | Status | Borrower | Loan Amount |
|---|---|---|---|
| Open | Repole Andrea G | $445,054 | |
| Closed | Repole Andrea G | $445,054 |
Source: Public Records
Tax History
| Year | Tax Paid | Tax Assessment Tax Assessment Total Assessment is a certain percentage of the fair market value that is determined by local assessors to be the total taxable value of land and additions on the property. | Land | Improvement |
|---|---|---|---|---|
| 2025 | $9,540 | $72,660 | $20,280 | $52,380 |
| 2024 | $9,540 | $69,480 | $20,280 | $49,200 |
| 2023 | $9,124 | $67,620 | $20,280 | $47,340 |
| 2022 | $8,539 | $64,560 | $20,280 | $44,280 |
| 2021 | $8,549 | $62,100 | $20,280 | $41,820 |
| 2020 | $3,900 | $60,540 | $20,280 | $40,260 |
| 2019 | $7,652 | $56,940 | $20,280 | $36,660 |
| 2018 | $7,006 | $35,830 | $11,329 | $24,501 |
| 2017 | $6,639 | $34,038 | $11,959 | $22,079 |
| 2016 | $6,136 | $32,246 | $12,615 | $19,631 |
| 2015 | $3,653 | $32,246 | $15,040 | $17,206 |
| 2014 | $3,653 | $31,648 | $15,698 | $15,950 |
Source: Public Records
Map
Nearby Homes
- 7914 14th Ave
- 1326 81st St
- 7724 13th Ave
- 1436 78th St
- 7615 13th Ave
- 1456 79th St
- 1246 81st St
- 7609 13th Ave
- 1324 83rd St
- 1302 83rd St Unit 211
- 1451 82nd St
- 1458 81st St
- 1408 76th St
- 7917 12th Ave
- 8315 13th Ave Unit 2D
- 8315 13th Ave Unit 3A
- 8315 13th Ave Unit 2A
- 8315 13th Ave Unit 3B
- 8323 13th Ave Unit 3A
- 8323 13th Ave Unit 3B
Your Personal Tour Guide
Ask me questions while you tour the home.