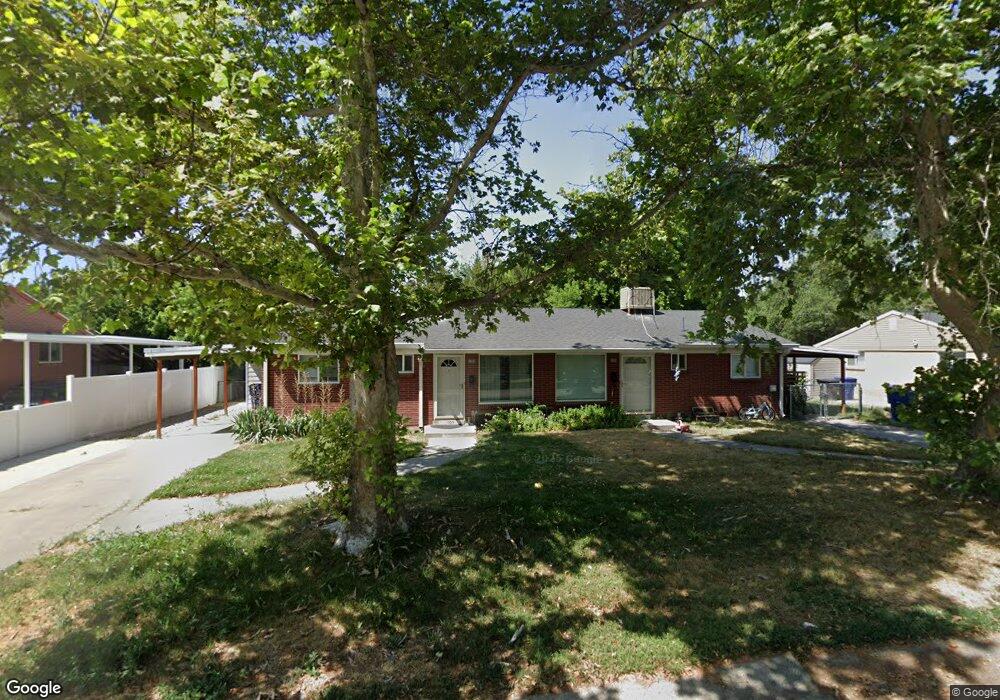
1353 E 4170 S Unit 1355 Salt Lake City, UT 84124
Estimated Value: $552,166 - $712,000
4
Beds
2
Baths
1,624
Sq Ft
$373/Sq Ft
Est. Value
About This Home
This home is located at 1353 E 4170 S Unit 1355, Salt Lake City, UT 84124 and is currently estimated at $605,542, approximately $372 per square foot. 1353 E 4170 S Unit 1355 is a home located in Salt Lake County with nearby schools including Crestview Elementary School, Olympus Junior High School, and Olympus High School.
Ownership History
Date
Name
Owned For
Owner Type
Purchase Details
Closed on
Jan 23, 2018
Sold by
Boss Steven and Boss Hollie
Bought by
4170 Place Llc
Current Estimated Value
Purchase Details
Closed on
Jan 3, 2018
Sold by
Sunderland Sean
Bought by
Boss Steven and Boss Hollie
Purchase Details
Closed on
Jan 2, 2013
Sold by
Sunderland Ernest G
Bought by
Sunderland Ernest G and Ernest G Sunderland Personal Trust
Purchase Details
Closed on
Apr 15, 2005
Sold by
Rhees Brent E and Rhees Pamela Sue
Bought by
Sunderland Ernest G
Purchase Details
Closed on
Dec 9, 2003
Sold by
Farnsworth Pamela Sue
Bought by
Rhees Brent E and Rhees Pamela Sue
Purchase Details
Closed on
Jun 16, 1994
Sold by
Farnsworth Joann Lee
Bought by
The Joann Farnsworth Family Trust
Create a Home Valuation Report for This Property
The Home Valuation Report is an in-depth analysis detailing your home's value as well as a comparison with similar homes in the area
Home Values in the Area
Average Home Value in this Area
Purchase History
| Date | Buyer | Sale Price | Title Company |
|---|---|---|---|
| 4170 Place Llc | -- | Vanguard Title Ins Agency | |
| Boss Steven | -- | Vanguard Title Ins Agency | |
| Sunderland Ernest G | -- | None Available | |
| Sunderland Ernest G | -- | Bonneville Title Co | |
| Rhees Brent E | -- | Bonneville Title Co | |
| The Joann Farnsworth Family Trust | -- | -- |
Source: Public Records
Tax History Compared to Growth
Tax History
| Year | Tax Paid | Tax Assessment Tax Assessment Total Assessment is a certain percentage of the fair market value that is determined by local assessors to be the total taxable value of land and additions on the property. | Land | Improvement |
|---|---|---|---|---|
| 2025 | $3,191 | $574,900 | $202,200 | $372,700 |
| 2024 | $3,191 | $510,900 | $195,900 | $315,000 |
| 2023 | $3,079 | $475,800 | $154,400 | $321,400 |
| 2022 | $3,130 | $486,300 | $151,400 | $334,900 |
| 2021 | $2,700 | $363,700 | $116,500 | $247,200 |
| 2020 | $2,645 | $336,300 | $111,100 | $225,200 |
| 2019 | $2,600 | $322,900 | $103,300 | $219,600 |
| 2018 | $2,589 | $309,600 | $103,300 | $206,300 |
| 2017 | $2,424 | $303,700 | $103,300 | $200,400 |
| 2016 | $2,049 | $259,200 | $103,300 | $155,900 |
| 2015 | $1,716 | $203,200 | $139,500 | $63,700 |
| 2014 | $1,589 | $184,000 | $133,000 | $51,000 |
Source: Public Records
Map
Nearby Homes
- 1363 E 4170 S Unit 1365
- 1466 E 4230 S
- 4145 S 1175 E
- 1211 E 4085 S
- 1466 Winderbrook Way
- 1371 E Skyview Dr
- 4008 S Vernon Cir Unit C
- 1089 E Sagehill Dr
- 1426 E Komenda Way Unit 19
- 4132 S Winder Ward Dr Unit 2-120
- 4468 S Manor Ridge Place Unit 19
- 4128 S Winder Ward Dr Unit 2-122
- Turner 2 Plan at Axis
- 1648 E 4150 S
- 4059 S 1045 E
- 3833 S 1300 E
- 4472 S 1500 E
- 4097 S Highland Dr Unit 3A
- 1562 E 3900 S Unit 105
- 1562 E 3900 S Unit 106
- 1345 E 4170 S Unit 1347
- 1350 Winder Ln
- 1358 E 4170 S Unit 1360
- 1360 Winder Ln
- 1360 E Winder Ln
- 1346 E 4170 S Unit 1348
- 1334 Winder Ln
- 1368 E 4170 S Unit 1370
- 1334 E Winder Ln
- 1375 E 4170 S
- 1331 E 4170 S
- 1368 Winder Ln
- 1334 E 4170 S Unit 1336
- 1355 E 4200 S
- 1326 E Winder Ln
- 1345 E 4200 S
- 1326 Winder Ln
- 1374 Winder Ln
- 1378 E 4170 S Unit 1380
- 1365 E 4200 S