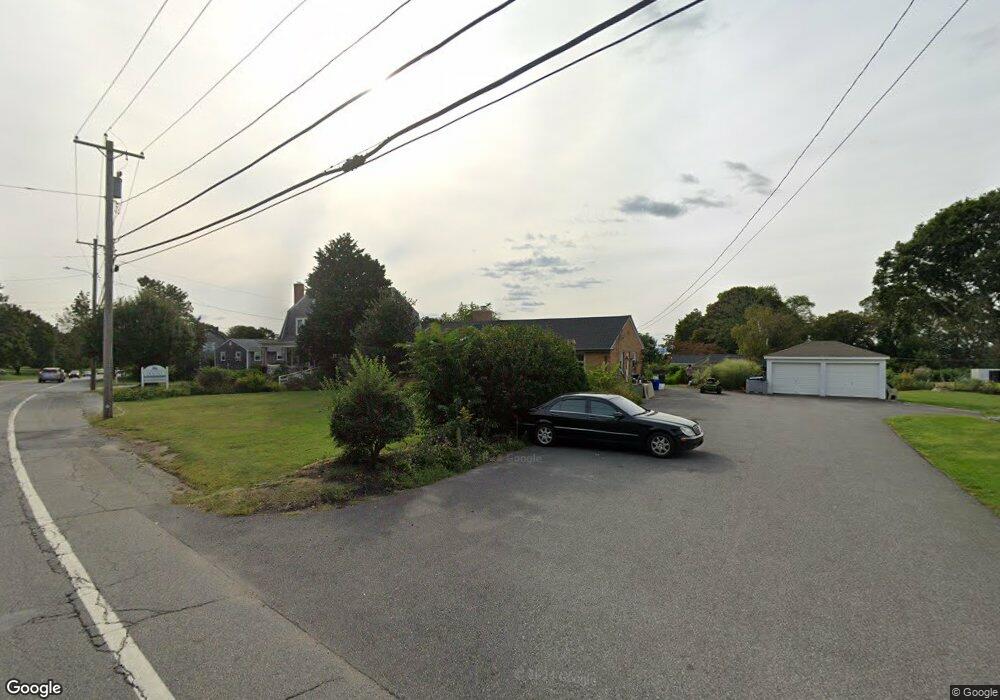
1353 Main Rd Tiverton, RI 02878
Estimated Value: $340,000 - $587,000
3
Beds
1
Bath
1,152
Sq Ft
$419/Sq Ft
Est. Value
About This Home
This home is located at 1353 Main Rd, Tiverton, RI 02878 and is currently estimated at $482,377, approximately $418 per square foot. 1353 Main Rd is a home located in Newport County with nearby schools including Tiverton High School and Saint Stanislaus School.
Ownership History
Date
Name
Owned For
Owner Type
Purchase Details
Closed on
Aug 12, 2016
Sold by
Dutchman Dental Llc
Bought by
Dmv Hldg Co Llc
Current Estimated Value
Home Financials for this Owner
Home Financials are based on the most recent Mortgage that was taken out on this home.
Original Mortgage
$320,000
Outstanding Balance
$255,323
Interest Rate
3.48%
Mortgage Type
New Conventional
Estimated Equity
$227,054
Purchase Details
Closed on
Sep 30, 2005
Sold by
Baer Joseph A and Baer Donna M
Bought by
Van-Regenmorter Jon Paul
Home Financials for this Owner
Home Financials are based on the most recent Mortgage that was taken out on this home.
Original Mortgage
$240,000
Interest Rate
5.84%
Mortgage Type
Purchase Money Mortgage
Purchase Details
Closed on
May 15, 2002
Sold by
Beaulieu Gina M
Bought by
Baer Joseph A and Baer Donna
Purchase Details
Closed on
Dec 30, 1999
Sold by
Pacheco Mary D Est
Bought by
Six Roy E and Six Gina
Create a Home Valuation Report for This Property
The Home Valuation Report is an in-depth analysis detailing your home's value as well as a comparison with similar homes in the area
Home Values in the Area
Average Home Value in this Area
Purchase History
| Date | Buyer | Sale Price | Title Company |
|---|---|---|---|
| Dmv Hldg Co Llc | -- | -- | |
| Van-Regenmorter Jon Paul | $50,000 | -- | |
| Baer Joseph A | $170,000 | -- | |
| Six Roy E | $122,000 | -- |
Source: Public Records
Mortgage History
| Date | Status | Borrower | Loan Amount |
|---|---|---|---|
| Open | Dmv Hldg Co Llc | $320,000 | |
| Previous Owner | Six Roy E | $240,000 | |
| Previous Owner | Six Roy E | $29,700 | |
| Previous Owner | Six Roy E | $225,950 |
Source: Public Records
Tax History Compared to Growth
Tax History
| Year | Tax Paid | Tax Assessment Tax Assessment Total Assessment is a certain percentage of the fair market value that is determined by local assessors to be the total taxable value of land and additions on the property. | Land | Improvement |
|---|---|---|---|---|
| 2025 | $3,873 | $350,500 | $86,800 | $263,700 |
| 2024 | $3,873 | $350,500 | $86,800 | $263,700 |
| 2023 | $3,406 | $228,600 | $66,300 | $162,300 |
| 2022 | $3,344 | $228,600 | $66,300 | $162,300 |
| 2021 | $3,262 | $228,600 | $66,300 | $162,300 |
| 2020 | $3,361 | $207,600 | $64,000 | $143,600 |
| 2019 | $3,090 | $195,700 | $64,000 | $131,700 |
| 2018 | $3,208 | $195,700 | $64,000 | $131,700 |
| 2017 | $2,774 | $145,600 | $64,000 | $81,600 |
| 2016 | $2,787 | $145,600 | $64,000 | $81,600 |
| 2015 | $2,789 | $145,700 | $64,000 | $81,700 |
| 2014 | $2,997 | $155,300 | $64,000 | $91,300 |
Source: Public Records
Map
Nearby Homes
- 50 Stevens St
- 8 Tucker Ave
- 153 Sakonnet Ridge Dr
- 42 Lewis St
- 1660 Main Rd
- 9 Cutter Ln
- 83 Waters Edge Unit 24
- 87 Waters Edge
- 10 Mount Hope Ave
- 169 Narragansett Blvd
- 174 Highland Rd
- 15 Rocky Ave
- 47 Watermark Dr
- 420 Cottrell Rd
- 898 Main Rd
- 896 Main Rd
- 100 Harbor Ridge Ln
- 0 Common Fence Blvd Unit 1364650
- 0 Common Fence Blvd Unit 1397142
- 1874 Main Rd