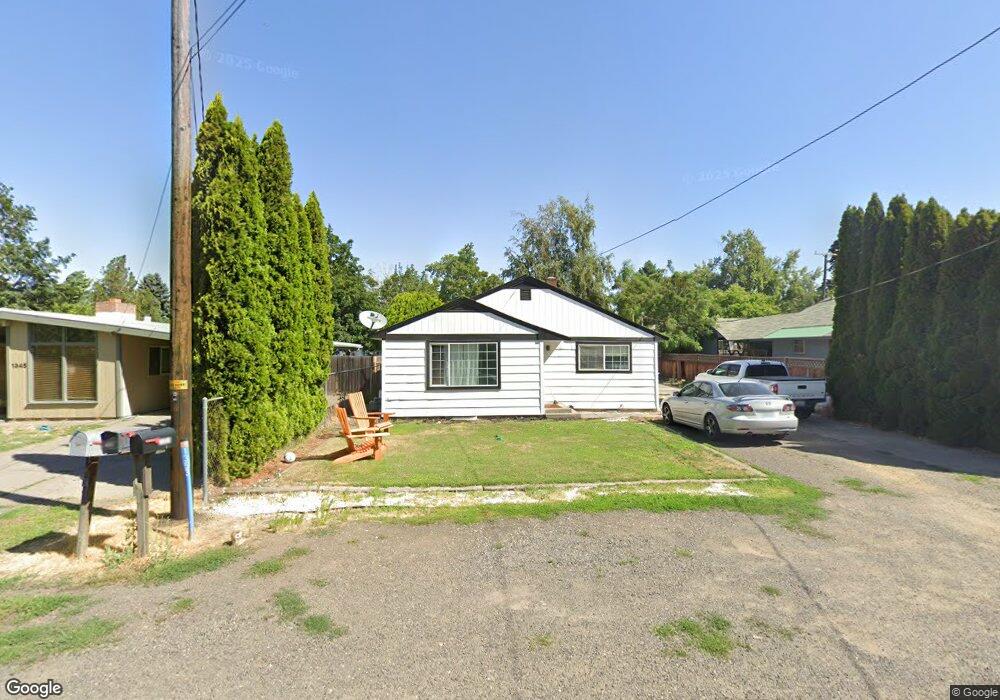
1353 Monroe St Walla Walla, WA 99362
Estimated Value: $306,000 - $340,000
3
Beds
1
Bath
1,184
Sq Ft
$270/Sq Ft
Est. Value
About This Home
This home is located at 1353 Monroe St, Walla Walla, WA 99362 and is currently estimated at $319,449, approximately $269 per square foot. 1353 Monroe St is a home located in Walla Walla County with nearby schools including Berney Elementary School, Pioneer Middle School, and R-Kidz Early Childhood Education Center.
Ownership History
Date
Name
Owned For
Owner Type
Purchase Details
Closed on
Aug 26, 2022
Sold by
Brenda Tapia
Bought by
Tapia Julio C
Current Estimated Value
Home Financials for this Owner
Home Financials are based on the most recent Mortgage that was taken out on this home.
Original Mortgage
$50,000
Outstanding Balance
$46,857
Interest Rate
5.3%
Mortgage Type
Credit Line Revolving
Estimated Equity
$272,592
Purchase Details
Closed on
Jul 30, 2009
Sold by
Sonoma Homes Llc
Bought by
Tapia Julio C
Home Financials for this Owner
Home Financials are based on the most recent Mortgage that was taken out on this home.
Original Mortgage
$144,790
Interest Rate
5.31%
Mortgage Type
FHA
Purchase Details
Closed on
Apr 21, 2009
Sold by
Salazar Josue C and Salazar Claudia
Bought by
Sonoma Homes Llc
Create a Home Valuation Report for This Property
The Home Valuation Report is an in-depth analysis detailing your home's value as well as a comparison with similar homes in the area
Home Values in the Area
Average Home Value in this Area
Purchase History
| Date | Buyer | Sale Price | Title Company |
|---|---|---|---|
| Tapia Julio C | -- | None Listed On Document | |
| Tapia Julio C | $147,500 | Land Title Of Walla Walla Co | |
| Sonoma Homes Llc | $132,000 | Land Title Of Walla Walla Co |
Source: Public Records
Mortgage History
| Date | Status | Borrower | Loan Amount |
|---|---|---|---|
| Open | Tapia Julio C | $50,000 | |
| Previous Owner | Tapia Julio C | $144,790 |
Source: Public Records
Tax History Compared to Growth
Tax History
| Year | Tax Paid | Tax Assessment Tax Assessment Total Assessment is a certain percentage of the fair market value that is determined by local assessors to be the total taxable value of land and additions on the property. | Land | Improvement |
|---|---|---|---|---|
| 2024 | $2,774 | $277,150 | $55,440 | $221,710 |
| 2023 | $2,774 | $277,150 | $55,440 | $221,710 |
| 2022 | $2,720 | $255,810 | $44,660 | $211,150 |
| 2021 | $2,268 | $228,270 | $44,660 | $183,610 |
| 2020 | $2,245 | $175,810 | $44,660 | $131,150 |
| 2019 | $1,895 | $175,810 | $44,660 | $131,150 |
| 2018 | $2,096 | $162,240 | $37,000 | $125,240 |
| 2017 | $1,829 | $150,850 | $37,000 | $113,850 |
| 2016 | $1,903 | $140,500 | $37,000 | $103,500 |
| 2015 | $1,921 | $140,500 | $37,000 | $103,500 |
| 2014 | -- | $140,500 | $37,000 | $103,500 |
| 2013 | -- | $140,500 | $37,000 | $103,500 |
Source: Public Records
Map
Nearby Homes
- 914 S Wilbur Ave
- 605 Holly St
- 608 Sycamore St
- 521 Ankeny St
- 1436 Bryant Ave
- 1341 Whitman St
- 1107 Pleasant St
- 514 School Ave
- 0 Tull Rd Unit NWM2317781
- 1120 Home Ave
- 1695 Ruth St
- 1820 Delmont St
- 1276 Whittington Ln
- 1913 Pleasant St
- 1723 Ruth St
- 940 Bryant Ave
- 1554 E Alder St
- 804 Fern Ave
- 913 Woodlawn St
- 1031 Woodlawn St
- 1345 Monroe St
- 926 S Wilbur Ave
- 1341 Monroe St
- 910 S Wilbur Ave
- 1344 Grant St
- 1344 Monroe St
- 1335 Monroe St
- 1002 S Wilbur Ave
- 1405 Monroe St
- 904 S Wilbur Ave
- 904 S Wilbur Ave Unit Ave
- 1338 Monroe St
- 1327 Monroe St
- 1404 Monroe St
- 1402 Grant St
- 1411 Monroe St
- 1332 Monroe St
- 1018 S Wilbur Ave
- 1408 Monroe St
- 1351 Grant St