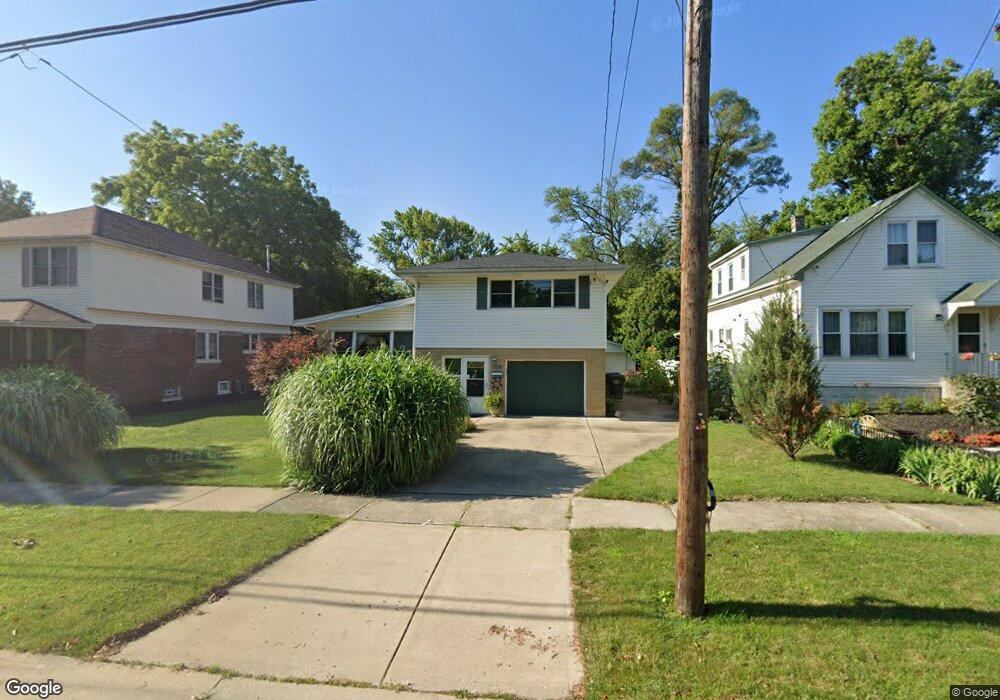
1353 Olive Rd Homewood, IL 60430
Estimated Value: $305,000 - $360,000
4
Beds
2
Baths
2,220
Sq Ft
$149/Sq Ft
Est. Value
About This Home
This home is located at 1353 Olive Rd, Homewood, IL 60430 and is currently estimated at $330,697, approximately $148 per square foot. 1353 Olive Rd is a home located in Cook County with nearby schools including Willow Elementary School, Winston Churchill School, and James Hart School.
Ownership History
Date
Name
Owned For
Owner Type
Purchase Details
Closed on
Apr 27, 2021
Sold by
Fidanza Albert P and Fidanza June
Bought by
Fidanza June and The June Fldanza Revocable Tru
Current Estimated Value
Purchase Details
Closed on
Mar 25, 2003
Sold by
Fidanza Albert P
Bought by
Fidanza June and Fidanza Albert P
Home Financials for this Owner
Home Financials are based on the most recent Mortgage that was taken out on this home.
Original Mortgage
$89,000
Interest Rate
5.95%
Mortgage Type
Unknown
Purchase Details
Closed on
Mar 28, 1996
Sold by
Scudder Jeanette L
Bought by
Fidanza Albert P
Home Financials for this Owner
Home Financials are based on the most recent Mortgage that was taken out on this home.
Original Mortgage
$100,000
Interest Rate
7.44%
Purchase Details
Closed on
Mar 18, 1996
Sold by
Lasalle National Trust Na
Bought by
Scudder Jeanette L
Home Financials for this Owner
Home Financials are based on the most recent Mortgage that was taken out on this home.
Original Mortgage
$100,000
Interest Rate
7.44%
Create a Home Valuation Report for This Property
The Home Valuation Report is an in-depth analysis detailing your home's value as well as a comparison with similar homes in the area
Home Values in the Area
Average Home Value in this Area
Purchase History
| Date | Buyer | Sale Price | Title Company |
|---|---|---|---|
| Fidanza June | -- | None Available | |
| Fidanza June | -- | Cti | |
| Fidanza June | -- | Cti | |
| Fidanza Albert P | $125,000 | -- | |
| Scudder Jeanette L | -- | -- |
Source: Public Records
Mortgage History
| Date | Status | Borrower | Loan Amount |
|---|---|---|---|
| Closed | Fidanza June | $89,000 | |
| Closed | Fidanza Albert P | $100,000 |
Source: Public Records
Tax History
| Year | Tax Paid | Tax Assessment Tax Assessment Total Assessment is a certain percentage of the fair market value that is determined by local assessors to be the total taxable value of land and additions on the property. | Land | Improvement |
|---|---|---|---|---|
| 2025 | $4,398 | $28,103 | $3,528 | $24,575 |
| 2024 | $4,398 | $28,103 | $3,528 | $24,575 |
| 2023 | $5,680 | $30,000 | $3,528 | $26,472 |
| 2022 | $5,680 | $19,649 | $3,087 | $16,562 |
| 2021 | $6,940 | $20,534 | $3,087 | $17,447 |
| 2020 | $6,939 | $20,534 | $3,087 | $17,447 |
| 2019 | $7,051 | $17,474 | $2,866 | $14,608 |
| 2018 | $7,498 | $19,551 | $2,866 | $16,685 |
| 2017 | $7,794 | $20,070 | $2,866 | $17,204 |
| 2016 | $5,806 | $14,190 | $2,646 | $11,544 |
| 2015 | $6,064 | $14,951 | $2,646 | $12,305 |
| 2014 | $7,011 | $17,096 | $2,646 | $14,450 |
| 2013 | $6,657 | $17,653 | $2,646 | $15,007 |
Source: Public Records
Map
Nearby Homes
- 1321 Ridge Rd
- 1236 Olive Rd
- 1465 Ridge Rd
- 1524 Olive Rd
- 18341 Poplar Ave
- 18234 Riegel Rd
- 1208 Evergreen Rd
- 1326 Hillview Rd
- 1121 Olive Rd
- 18000 Armitage Ct
- 18144 Aberdeen St
- 1617 183rd St
- 1525 Burr Oak Rd
- 1428 E Lyn Ct
- 18350 Carpenter St
- 18524 Lyn Ct
- 18430 Aberdeen St
- 1624 Burr Oak Rd
- 18229 Hart Dr
- 1750 183rd St
Your Personal Tour Guide
Ask me questions while you tour the home.