Estimated Value: $272,000 - $290,576
3
Beds
2
Baths
1,299
Sq Ft
$219/Sq Ft
Est. Value
About This Home
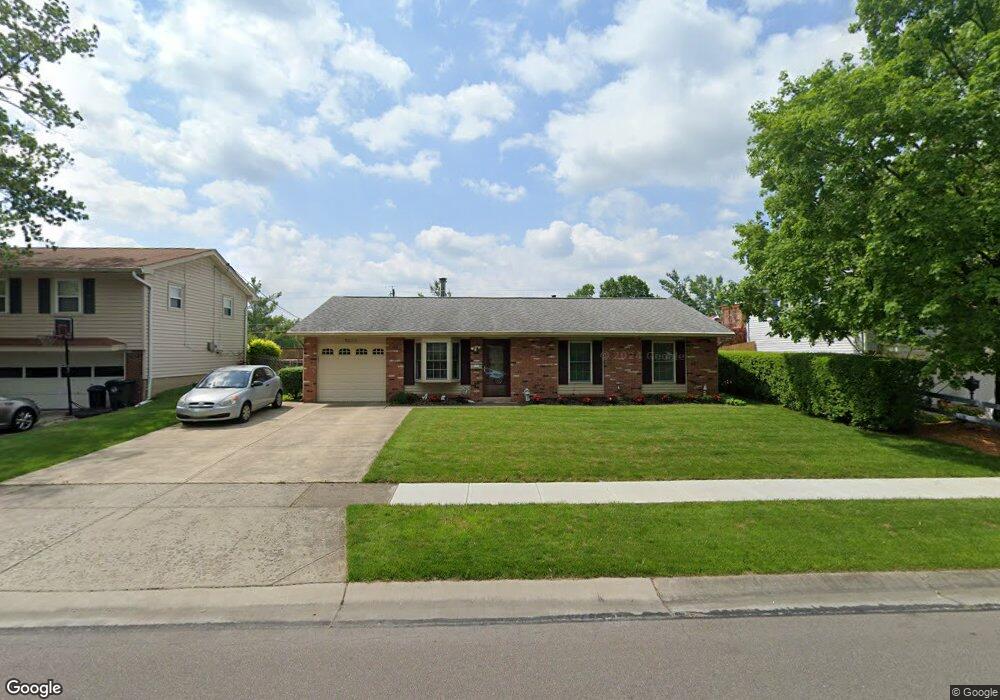
This home is located at 1353 Windward Dr, Mason, OH 45040 and is currently estimated at $284,144, approximately $218 per square foot. 1353 Windward Dr is a home located in Warren County with nearby schools including Mason Intermediate Elementary School, Mason Middle School, and William Mason High School.
Ownership History
Date
Name
Owned For
Owner Type
Purchase Details
Closed on
Aug 5, 2021
Sold by
Vanvuren Richard J
Bought by
Vanvuren Richard J
Current Estimated Value
Purchase Details
Closed on
Dec 8, 2017
Sold by
Vanvuren Richard J and Vanvuren Van Vuren
Bought by
Vanvuren Richard J
Purchase Details
Closed on
Mar 25, 2005
Sold by
Pomerantz Mark
Bought by
Vanburen Richard J and Vanburen Van Buren
Purchase Details
Closed on
Aug 4, 2000
Sold by
Lewis Bradley
Bought by
Pomerantz Mark
Home Financials for this Owner
Home Financials are based on the most recent Mortgage that was taken out on this home.
Original Mortgage
$85,000
Outstanding Balance
$28,600
Interest Rate
8.19%
Mortgage Type
New Conventional
Estimated Equity
$255,544
Purchase Details
Closed on
Dec 1, 1992
Sold by
Dearduff A.Henry and Dearduff J.Fay
Bought by
Lewis and Lewis Bradley A
Purchase Details
Closed on
Oct 23, 1985
Sold by
Leeds Mark E and Leeds Inez
Bought by
Dearduff and Dearduff Ahenry
Purchase Details
Closed on
May 8, 1984
Sold by
Wilson Albert B and Wilson Alien
Bought by
Leeds and Leeds Mark E
Create a Home Valuation Report for This Property
The Home Valuation Report is an in-depth analysis detailing your home's value as well as a comparison with similar homes in the area
Home Values in the Area
Average Home Value in this Area
Purchase History
| Date | Buyer | Sale Price | Title Company |
|---|---|---|---|
| Vanvuren Richard J | -- | None Available | |
| Vanvuren Richard J | -- | -- | |
| Vanburen Richard J | $124,000 | -- | |
| Pomerantz Mark | $106,300 | -- | |
| Lewis | $78,500 | -- | |
| Dearduff | $56,000 | -- | |
| Leeds | $40,000 | -- |
Source: Public Records
Mortgage History
| Date | Status | Borrower | Loan Amount |
|---|---|---|---|
| Open | Pomerantz Mark | $85,000 |
Source: Public Records
Tax History
| Year | Tax Paid | Tax Assessment Tax Assessment Total Assessment is a certain percentage of the fair market value that is determined by local assessors to be the total taxable value of land and additions on the property. | Land | Improvement |
|---|---|---|---|---|
| 2025 | $2,681 | $75,860 | $24,500 | $51,360 |
| 2024 | $2,681 | $75,860 | $24,500 | $51,360 |
| 2023 | $2,290 | $56,413 | $10,762 | $45,650 |
| 2022 | $2,260 | $56,413 | $10,763 | $45,651 |
| 2021 | $2,141 | $56,413 | $10,763 | $45,651 |
| 2020 | $1,944 | $45,864 | $8,750 | $37,114 |
| 2019 | $1,787 | $45,864 | $8,750 | $37,114 |
| 2018 | $1,793 | $45,864 | $8,750 | $37,114 |
| 2017 | $1,594 | $39,540 | $8,274 | $31,266 |
| 2016 | $1,642 | $39,540 | $8,274 | $31,266 |
| 2015 | $1,645 | $39,540 | $8,274 | $31,266 |
| 2014 | $1,616 | $36,950 | $7,730 | $29,220 |
| 2013 | $1,619 | $41,830 | $8,750 | $33,080 |
Source: Public Records
Map
Nearby Homes
- 792 Majken Place
- 899 Tradewind Dr
- 1475 St Lawrence Dr
- 968 Olympia Dr
- 1041 Sheffield Dr
- 8335 Charming Manor
- 6300 Amber Ct
- 6404 Coverage Ct
- 6394 Coverage Ct
- 6382 Coverage Ct
- 6411 Coverage Ct
- 6378 Coverage Ct
- 6364 Coverage Ct
- 6354 Coverage Ct
- 6403 Nicholas Way
- 6393 Nicholas Way
- 6179 Nicholas Way
- 6358 Coverage Ct
- 6379 Coverage Ct
- 6175 Nicholas Way
- 1343 Windward Dr
- 1361 Windward Dr
- 1335 Windward Dr
- 1371 Windward Dr
- 1356 Windward Dr
- 1344 Windward Dr
- 1327 Windward Dr
- 1379 Windward Dr
- 1364 Windward Dr
- 1336 Windward Dr
- 1374 Windward Dr
- 1315 Windward Dr
- 1326 Windward Dr
- 1391 Windward Dr
- 818 Tradewind Dr
- 826 Tradewind Dr
- 1382 Windward Dr
- 1329 Jennings Ct
- 836 Tradewind Dr
- 1337 Jennings Ct
Your Personal Tour Guide
Ask me questions while you tour the home.