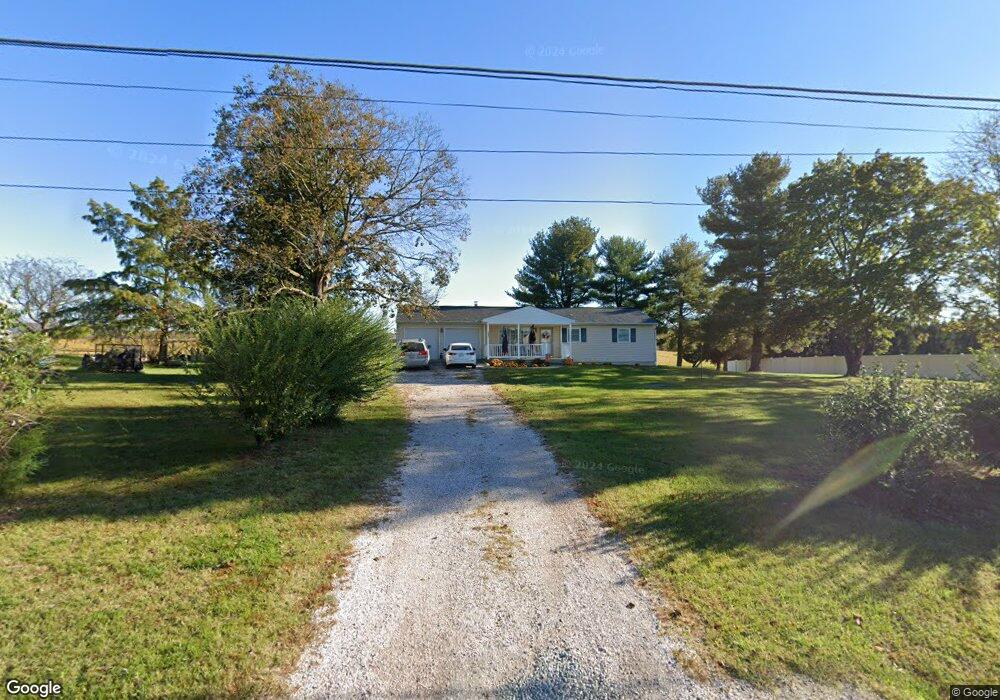
13531 Moser Rd Thurmont, MD 21788
Estimated Value: $265,422 - $277,000
--
Bed
1
Bath
960
Sq Ft
$282/Sq Ft
Est. Value
About This Home
This home is located at 13531 Moser Rd, Thurmont, MD 21788 and is currently estimated at $271,106, approximately $282 per square foot. 13531 Moser Rd is a home located in Frederick County with nearby schools including Thurmont Primary School, Thurmont Elementary School, and Thurmont Middle School.
Ownership History
Date
Name
Owned For
Owner Type
Purchase Details
Closed on
Apr 26, 2018
Sold by
Sparkman Mary and Sparkman Hughie
Bought by
Sparkman Deona
Current Estimated Value
Home Financials for this Owner
Home Financials are based on the most recent Mortgage that was taken out on this home.
Original Mortgage
$156,550
Outstanding Balance
$134,950
Interest Rate
4.45%
Mortgage Type
New Conventional
Estimated Equity
$136,156
Purchase Details
Closed on
Jun 11, 2015
Sold by
U S Bank National Association
Bought by
Sparkman Mary and Sparkman Hughie
Purchase Details
Closed on
Nov 10, 2014
Sold by
See Rachel and Heims Agnes M
Bought by
U S Bank National Association
Purchase Details
Closed on
Dec 2, 2005
Sold by
Heims Charles E Wife
Bought by
Heims Agnes M and See Rachel A
Purchase Details
Closed on
Oct 9, 2005
Sold by
Heims Charles E Wife
Bought by
Heims Agnes M and See Rachel A
Create a Home Valuation Report for This Property
The Home Valuation Report is an in-depth analysis detailing your home's value as well as a comparison with similar homes in the area
Home Values in the Area
Average Home Value in this Area
Purchase History
| Date | Buyer | Sale Price | Title Company |
|---|---|---|---|
| Sparkman Deona | $155,000 | None Available | |
| Sparkman Mary | $104,475 | Attorney | |
| U S Bank National Association | $166,950 | None Available | |
| Heims Agnes M | -- | -- | |
| Heims Agnes M | -- | -- |
Source: Public Records
Mortgage History
| Date | Status | Borrower | Loan Amount |
|---|---|---|---|
| Open | Sparkman Deona | $156,550 |
Source: Public Records
Tax History Compared to Growth
Tax History
| Year | Tax Paid | Tax Assessment Tax Assessment Total Assessment is a certain percentage of the fair market value that is determined by local assessors to be the total taxable value of land and additions on the property. | Land | Improvement |
|---|---|---|---|---|
| 2025 | $2,402 | $201,667 | -- | -- |
| 2024 | $2,402 | $189,333 | $0 | $0 |
| 2023 | $2,204 | $177,000 | $76,800 | $100,200 |
| 2022 | $2,150 | $172,367 | $0 | $0 |
| 2021 | $2,069 | $167,733 | $0 | $0 |
| 2020 | $2,042 | $163,100 | $76,800 | $86,300 |
| 2019 | $1,998 | $159,267 | $0 | $0 |
| 2018 | $1,822 | $155,433 | $0 | $0 |
| 2017 | $1,863 | $151,600 | $0 | $0 |
| 2016 | $2,019 | $147,633 | $0 | $0 |
| 2015 | $2,019 | $143,667 | $0 | $0 |
| 2014 | $2,019 | $139,700 | $0 | $0 |
Source: Public Records
Map
Nearby Homes
- 15 Blackford Cir
- 105 Colliery Dr
- 9 Todd Ct
- 120 Victor Dr
- 00 Creagerstown Rd
- 111 Summit Ave
- 19 Sunny Way
- 110 E Hammaker St
- 13714 Hillside Ave
- 30 Frederick Rd
- 16 Lombard St
- 18 Water St
- 9 Easy St
- 17 East St
- 5 Radio Ln
- 16A Elm St
- 130 N Altamont Ave
- 304 Apples Church Rd
- 58 Mountaintop Rd
- 59 Mountaintop Rd