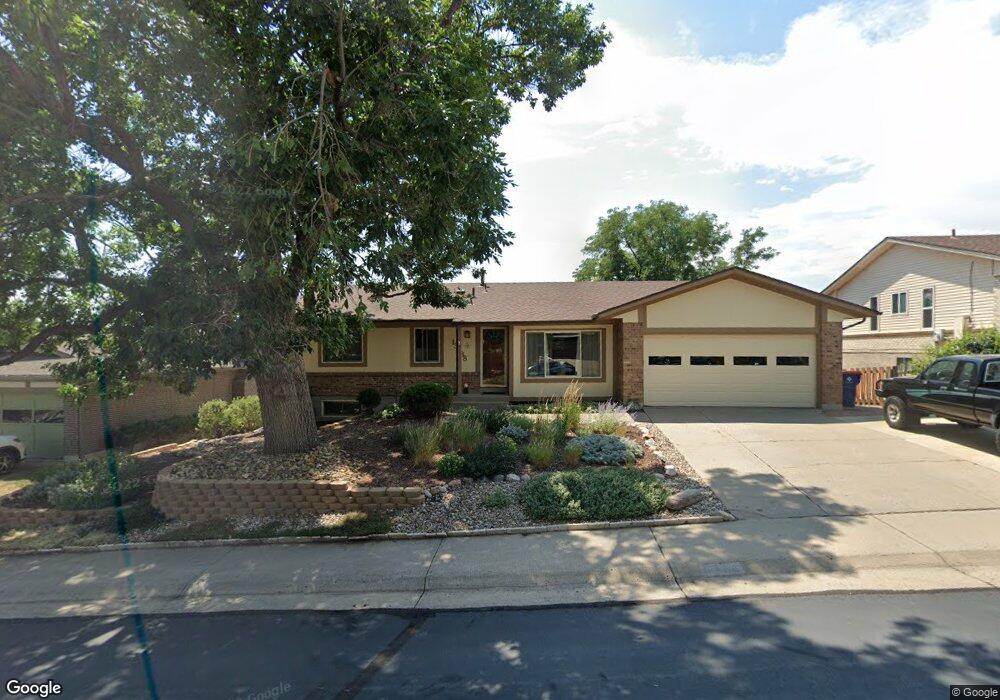
13538 W Montana Place Lakewood, CO 80228
Green Mountain NeighborhoodEstimated Value: $664,941 - $716,000
5
Beds
5
Baths
1,492
Sq Ft
$459/Sq Ft
Est. Value
About This Home
This home is located at 13538 W Montana Place, Lakewood, CO 80228 and is currently estimated at $685,485, approximately $459 per square foot. 13538 W Montana Place is a home located in Jefferson County with nearby schools including Hutchinson Elementary School, Dunstan Middle School, and Green Mountain High School.
Ownership History
Date
Name
Owned For
Owner Type
Purchase Details
Closed on
Jan 24, 2012
Sold by
Gittleman Louis T
Bought by
Gittleman Louis T and Klamerus Katherine
Current Estimated Value
Home Financials for this Owner
Home Financials are based on the most recent Mortgage that was taken out on this home.
Original Mortgage
$136,500
Outstanding Balance
$14,999
Interest Rate
3.25%
Mortgage Type
FHA
Estimated Equity
$670,486
Purchase Details
Closed on
Aug 22, 2003
Sold by
Palik Nancy A and Hoskins Doreen A
Bought by
Gittleman Louis T
Home Financials for this Owner
Home Financials are based on the most recent Mortgage that was taken out on this home.
Original Mortgage
$163,000
Interest Rate
5.71%
Mortgage Type
Purchase Money Mortgage
Purchase Details
Closed on
Aug 16, 2001
Sold by
Hoskins Sophie L
Bought by
Palik Nancy A and Hoskins Doreen A
Purchase Details
Closed on
Oct 19, 1999
Sold by
Hoskins Howard R Hoskins Sophie L
Bought by
Hoskins Sophie L
Create a Home Valuation Report for This Property
The Home Valuation Report is an in-depth analysis detailing your home's value as well as a comparison with similar homes in the area
Home Values in the Area
Average Home Value in this Area
Purchase History
| Date | Buyer | Sale Price | Title Company |
|---|---|---|---|
| Gittleman Louis T | -- | None Available | |
| Gittleman Louis T | $243,000 | Guardian Title | |
| Palik Nancy A | -- | -- | |
| Hoskins Sophie L | -- | -- |
Source: Public Records
Mortgage History
| Date | Status | Borrower | Loan Amount |
|---|---|---|---|
| Open | Gittleman Louis T | $136,500 | |
| Closed | Gittleman Louis T | $163,000 |
Source: Public Records
Tax History Compared to Growth
Tax History
| Year | Tax Paid | Tax Assessment Tax Assessment Total Assessment is a certain percentage of the fair market value that is determined by local assessors to be the total taxable value of land and additions on the property. | Land | Improvement |
|---|---|---|---|---|
| 2024 | $3,182 | $41,988 | $16,327 | $25,661 |
| 2023 | $3,182 | $41,988 | $16,327 | $25,661 |
| 2022 | $3,046 | $33,023 | $13,596 | $19,427 |
| 2021 | $3,090 | $33,973 | $13,987 | $19,986 |
| 2020 | $2,760 | $30,482 | $11,526 | $18,956 |
| 2019 | $2,725 | $30,482 | $11,526 | $18,956 |
| 2018 | $2,657 | $28,748 | $7,833 | $20,915 |
| 2017 | $2,335 | $28,748 | $7,833 | $20,915 |
| 2016 | $2,393 | $27,492 | $6,852 | $20,640 |
| 2015 | $2,173 | $27,492 | $6,852 | $20,640 |
| 2014 | $2,173 | $22,869 | $6,368 | $16,501 |
Source: Public Records
Map
Nearby Homes
- 1650 S Deframe St Unit B5
- 13231 W Montana Ave
- 1648 S Cole St Unit B7
- 13233 W Utah Cir
- 1655 S Cole St Unit B1
- 1697 S Cole St Unit C2
- 12948 W Oregon Dr
- 1825 S Zang Ct
- 1882 S Zinnia Way
- 12742 W Florida Dr
- 13349 W Alameda Pkwy Unit 303
- 13349 W Alameda Pkwy Unit 104
- 13349 W Alameda Pkwy Unit 102
- 2175 S Deframe St
- 1332 S Yank St
- 13934 W Warren Dr
- 2037 S Welch Cir
- 322 S Alkire St
- 1414 S Ward St
- 12711 W Jewell Cir
- 13558 W Montana Place
- 13478 W Montana Place
- 13578 W Montana Place
- 13458 W Montana Place
- 13547 W Montana Place
- 13487 W Montana Place
- 13567 W Montana Place
- 13467 W Montana Place
- 13638 W Montana Place
- 13438 W Montana Place
- 13647 W Montana Place
- 1806 S Cole Ct
- 1794 S Braun Ct
- 13437 W Montana Place
- 1807 S Cole Ct
- 1785 S Braun Ct
- 13658 W Montana Place
- 1774 S Braun Ct
- 1803 S Beech St
- 1816 S Cole Ct