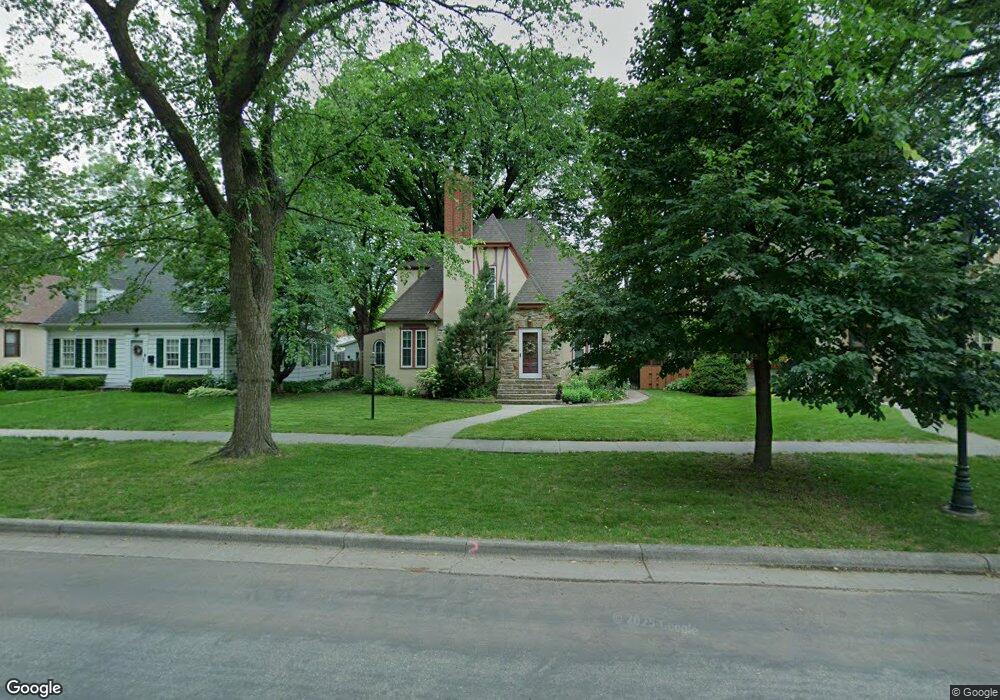
1354 4th St N Fargo, ND 58102
Horace Mann NeighborhoodEstimated Value: $294,000 - $357,000
3
Beds
4
Baths
1,587
Sq Ft
$208/Sq Ft
Est. Value
About This Home
This home is located at 1354 4th St N, Fargo, ND 58102 and is currently estimated at $330,651, approximately $208 per square foot. 1354 4th St N is a home located in Cass County with nearby schools including Horace Mann Roosevelt Elementary School, Ben Franklin Middle School, and North High School.
Ownership History
Date
Name
Owned For
Owner Type
Purchase Details
Closed on
Mar 13, 2014
Sold by
Tyryfter Eric and Tyryfter Alissa
Bought by
Bank Of America Na
Current Estimated Value
Purchase Details
Closed on
Nov 30, 2005
Sold by
Kippley William W and Kihi Kippley Jane
Bought by
Syvertson James A and Syvertson Anita M
Create a Home Valuation Report for This Property
The Home Valuation Report is an in-depth analysis detailing your home's value as well as a comparison with similar homes in the area
Home Values in the Area
Average Home Value in this Area
Purchase History
| Date | Buyer | Sale Price | Title Company |
|---|---|---|---|
| Bank Of America Na | $145,097 | None Available | |
| Syvertson James A | -- | -- |
Source: Public Records
Tax History Compared to Growth
Tax History
| Year | Tax Paid | Tax Assessment Tax Assessment Total Assessment is a certain percentage of the fair market value that is determined by local assessors to be the total taxable value of land and additions on the property. | Land | Improvement |
|---|---|---|---|---|
| 2024 | $5,004 | $151,700 | $22,300 | $129,400 |
| 2023 | $5,387 | $147,300 | $22,300 | $125,000 |
| 2022 | $4,645 | $144,400 | $22,300 | $122,100 |
| 2021 | $4,322 | $134,950 | $22,300 | $112,650 |
| 2020 | $4,274 | $134,950 | $22,300 | $112,650 |
| 2019 | $4,278 | $134,950 | $12,400 | $122,550 |
| 2018 | $3,505 | $106,900 | $12,400 | $94,500 |
| 2017 | $3,299 | $101,800 | $12,400 | $89,400 |
| 2016 | $2,825 | $90,900 | $12,400 | $78,500 |
| 2015 | $2,968 | $90,900 | $9,300 | $81,600 |
| 2014 | $3,820 | $121,700 | $9,300 | $112,400 |
| 2013 | $3,828 | $121,700 | $9,300 | $112,400 |
Source: Public Records
Map
Nearby Homes