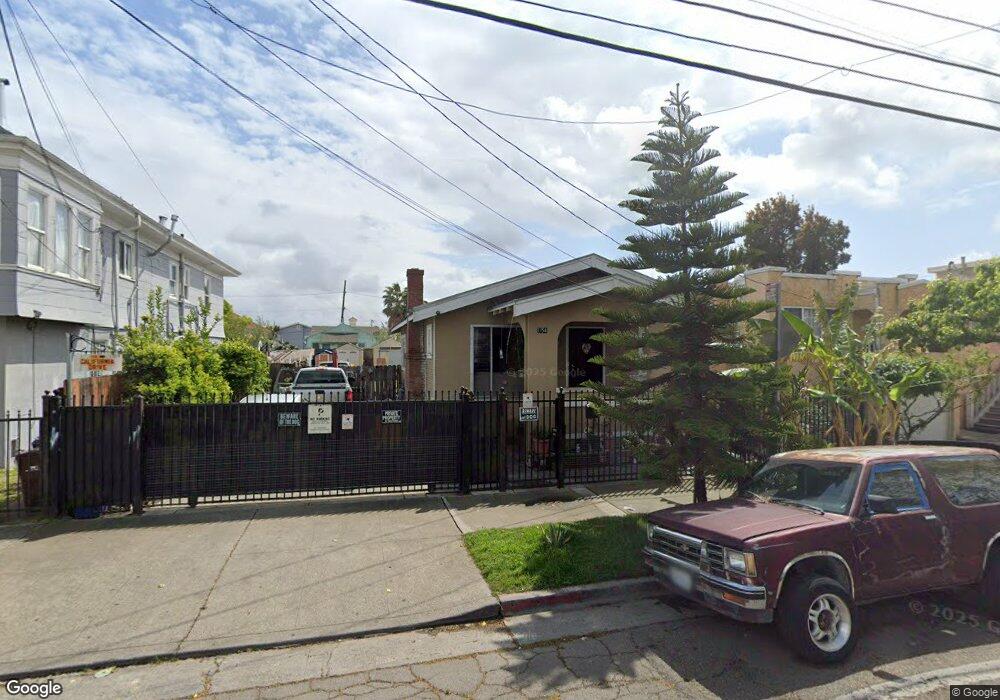
1354 90th Ave Oakland, CA 94603
Highland NeighborhoodEstimated Value: $376,000 - $450,081
2
Beds
1
Bath
937
Sq Ft
$446/Sq Ft
Est. Value
About This Home
This home is located at 1354 90th Ave, Oakland, CA 94603 and is currently estimated at $417,520, approximately $445 per square foot. 1354 90th Ave is a home located in Alameda County with nearby schools including New Highland Academy, Encompass Academy Elementary, and Acorn Woodland Elementary School.
Ownership History
Date
Name
Owned For
Owner Type
Purchase Details
Closed on
Jan 7, 2015
Sold by
Kwong David
Bought by
Vazquez Alberto
Current Estimated Value
Home Financials for this Owner
Home Financials are based on the most recent Mortgage that was taken out on this home.
Original Mortgage
$235,653
Outstanding Balance
$183,963
Interest Rate
4.37%
Mortgage Type
FHA
Estimated Equity
$233,557
Purchase Details
Closed on
Aug 12, 2010
Sold by
Kwong Mona
Bought by
Kwong David
Purchase Details
Closed on
Aug 6, 2010
Sold by
Brown Michael Marion
Bought by
Kwong David
Create a Home Valuation Report for This Property
The Home Valuation Report is an in-depth analysis detailing your home's value as well as a comparison with similar homes in the area
Home Values in the Area
Average Home Value in this Area
Purchase History
We collect this data history from publicly available records. To have your information removed, we recommend requesting removal directly through your county’s website.
| Date | Buyer | Sale Price | Title Company |
|---|---|---|---|
| Vazquez Alberto | $240,000 | North American Title Company | |
| Kwong David | -- | Old Republic Title Company | |
| Kwong David | $90,000 | Old Republic Title Company |
Source: Public Records
Mortgage History
We collect this data history from publicly available records. To have your information removed, we recommend requesting removal directly through your county’s website.
| Date | Status | Borrower | Loan Amount |
|---|---|---|---|
| Open | Vazquez Alberto | $235,653 |
Source: Public Records
Tax History
| Year | Tax Paid | Tax Assessment Tax Assessment Total Assessment is a certain percentage of the fair market value that is determined by local assessors to be the total taxable value of land and additions on the property. | Land | Improvement |
|---|---|---|---|---|
| 2025 | $5,167 | $281,434 | $86,530 | $201,904 |
| 2024 | $5,167 | $275,780 | $84,834 | $197,946 |
| 2023 | $5,342 | $277,235 | $83,170 | $194,065 |
| 2022 | $5,144 | $264,800 | $81,540 | $190,260 |
| 2021 | $4,809 | $259,471 | $79,941 | $186,530 |
| 2020 | $4,750 | $263,740 | $79,122 | $184,618 |
| 2019 | $4,499 | $258,570 | $77,571 | $180,999 |
| 2018 | $4,399 | $253,501 | $76,050 | $177,451 |
| 2017 | $4,197 | $248,531 | $74,559 | $173,972 |
| 2016 | $4,110 | $243,660 | $73,098 | $170,562 |
| 2015 | $2,330 | $95,940 | $28,782 | $67,158 |
| 2014 | $2,198 | $94,060 | $28,218 | $65,842 |
Source: Public Records
Map
Nearby Homes
Your Personal Tour Guide
Ask me questions while you tour the home.