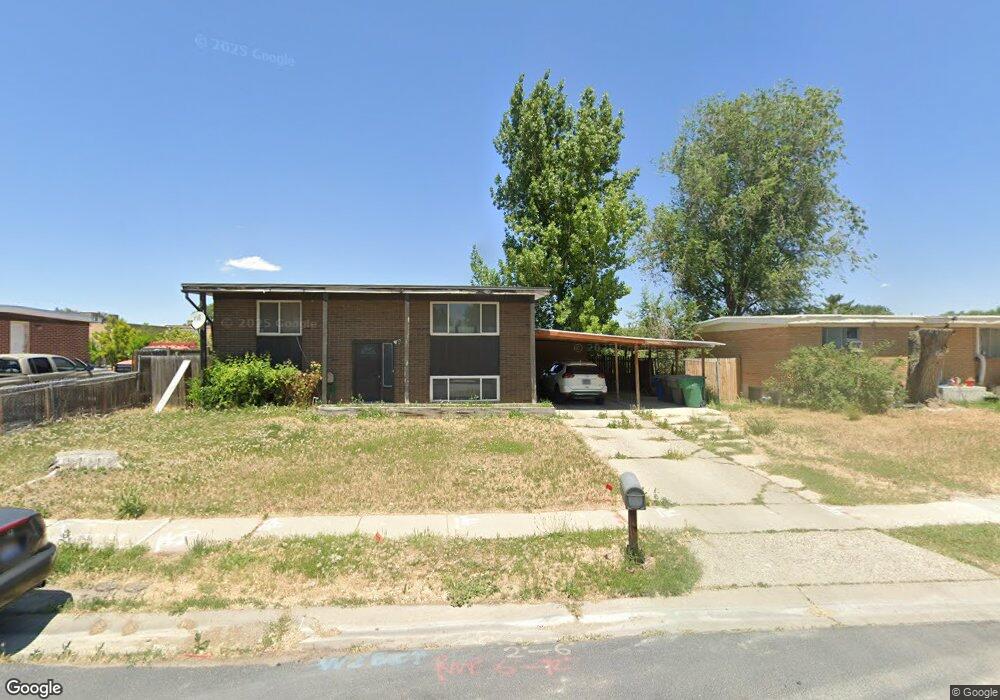
1354 W 7125 S West Jordan, UT 84084
Estimated Value: $427,000 - $468,000
4
Beds
2
Baths
1,800
Sq Ft
$252/Sq Ft
Est. Value
About This Home
This home is located at 1354 W 7125 S, West Jordan, UT 84084 and is currently estimated at $453,280, approximately $251 per square foot. 1354 W 7125 S is a home located in Salt Lake County with nearby schools including Heartland Elementary School, West Jordan Middle School, and West Jordan High School.
Ownership History
Date
Name
Owned For
Owner Type
Purchase Details
Closed on
Aug 17, 2005
Sold by
Caplette Marcella K and Northrup Marcella K
Bought by
Northrup Marcella K
Current Estimated Value
Home Financials for this Owner
Home Financials are based on the most recent Mortgage that was taken out on this home.
Original Mortgage
$112,000
Outstanding Balance
$61,048
Interest Rate
6.25%
Mortgage Type
Stand Alone First
Estimated Equity
$392,232
Purchase Details
Closed on
Jan 5, 1999
Sold by
Mesa Equities Llc
Bought by
Mower Kelly
Purchase Details
Closed on
Mar 20, 1998
Sold by
Sigman Melvin S
Bought by
Sigman Melvin S and Mower Kelly
Purchase Details
Closed on
Mar 16, 1998
Sold by
Johnson Brian R
Bought by
Sigman Melvin
Purchase Details
Closed on
Nov 8, 1993
Sold by
Cisneros Henry G
Bought by
Johnson Brian R
Home Financials for this Owner
Home Financials are based on the most recent Mortgage that was taken out on this home.
Original Mortgage
$73,034
Interest Rate
6.97%
Mortgage Type
FHA
Create a Home Valuation Report for This Property
The Home Valuation Report is an in-depth analysis detailing your home's value as well as a comparison with similar homes in the area
Home Values in the Area
Average Home Value in this Area
Purchase History
| Date | Buyer | Sale Price | Title Company |
|---|---|---|---|
| Northrup Marcella K | -- | Equity Title | |
| Mower Kelly | -- | Landmark Title Company | |
| Sigman Melvin S | -- | Landmark Title | |
| Sigman Melvin | -- | -- | |
| Johnson Brian R | -- | -- | |
| Johnson Brian R | -- | -- |
Source: Public Records
Mortgage History
| Date | Status | Borrower | Loan Amount |
|---|---|---|---|
| Open | Northrup Marcella K | $112,000 | |
| Previous Owner | Johnson Brian R | $73,034 |
Source: Public Records
Tax History Compared to Growth
Tax History
| Year | Tax Paid | Tax Assessment Tax Assessment Total Assessment is a certain percentage of the fair market value that is determined by local assessors to be the total taxable value of land and additions on the property. | Land | Improvement |
|---|---|---|---|---|
| 2025 | $1,918 | $399,000 | $127,200 | $271,800 |
| 2024 | $1,918 | $369,000 | $117,100 | $251,900 |
| 2023 | $1,918 | $347,700 | $112,600 | $235,100 |
| 2022 | $2,010 | $358,500 | $110,400 | $248,100 |
| 2021 | $1,719 | $279,100 | $84,800 | $194,300 |
| 2020 | $1,646 | $250,900 | $73,300 | $177,600 |
| 2019 | $1,522 | $227,500 | $73,300 | $154,200 |
| 2018 | $1,386 | $205,500 | $70,100 | $135,400 |
| 2017 | $1,278 | $188,600 | $70,100 | $118,500 |
| 2016 | $1,198 | $166,100 | $70,100 | $96,000 |
| 2015 | $1,221 | $165,100 | $74,800 | $90,300 |
| 2014 | $1,095 | $145,800 | $66,800 | $79,000 |
Source: Public Records
Map
Nearby Homes
- 7194 S 1380 W
- 7165 Callie Dr
- 1384 W 7290 S
- 7118 S Equator Ln Unit 14 B
- 7108 S 1205 W
- 1235 W Athleen Dr
- 7087 S 1205 W
- 1607 W Beamon St
- 7340 S Seven Tree Ln Unit 76
- 6937 S Hollow View Way
- 1146 Athleen Dr
- 1516 W 7470 S
- 6987 Overview Way
- 1718 W Trey Way Unit 2
- 6773 S 1300 W
- 7279 S Kenadi Ct
- 7149 S Camelot Way
- 1678 Leland Dr
- 7150 Camelot Way
- 6687 Bonham Ln