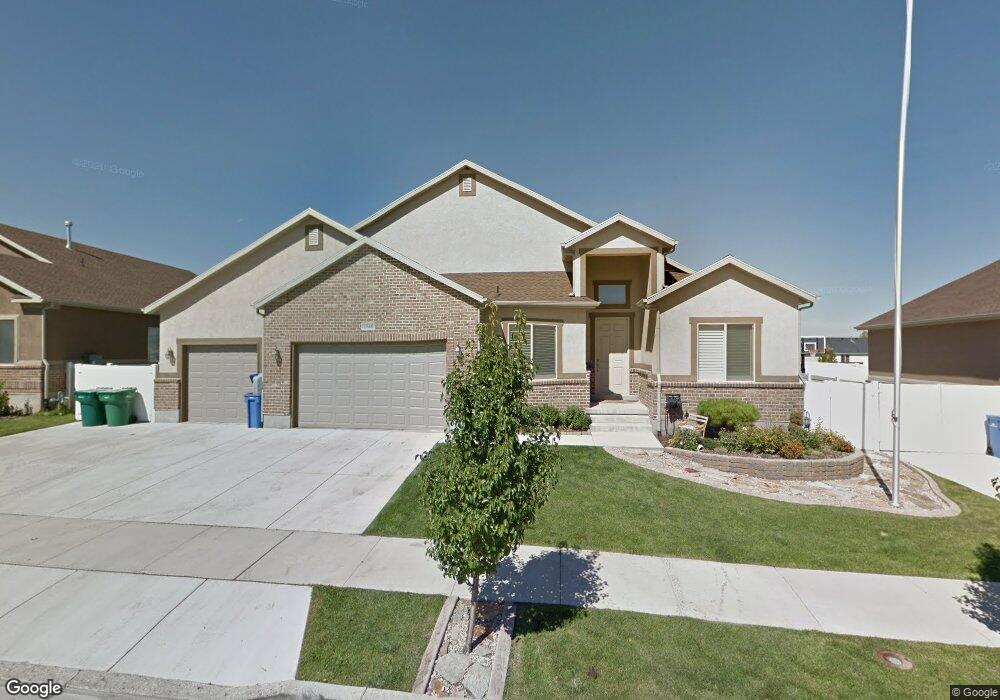
13548 Crimson Patch Way Riverton, UT 84096
Estimated Value: $664,000 - $908,000
3
Beds
3
Baths
1,960
Sq Ft
$372/Sq Ft
Est. Value
About This Home
This home is located at 13548 Crimson Patch Way, Riverton, UT 84096 and is currently estimated at $729,511, approximately $372 per square foot. 13548 Crimson Patch Way is a home located in Salt Lake County with nearby schools including Foothills School, South Hills Middle School, and Mountain Ridge High School.
Ownership History
Date
Name
Owned For
Owner Type
Purchase Details
Closed on
Apr 14, 2023
Sold by
Cook Linda
Bought by
Linda Cook Trust
Current Estimated Value
Purchase Details
Closed on
Aug 31, 2016
Sold by
Cook Daniel and Cook Linda
Bought by
Cook Linda and Cook Daniel
Home Financials for this Owner
Home Financials are based on the most recent Mortgage that was taken out on this home.
Original Mortgage
$172,000
Interest Rate
2.78%
Mortgage Type
New Conventional
Purchase Details
Closed on
Oct 26, 2006
Sold by
D R Horton Inc
Bought by
Cook Daniel and Cook Linda
Home Financials for this Owner
Home Financials are based on the most recent Mortgage that was taken out on this home.
Original Mortgage
$76,251
Interest Rate
6.08%
Mortgage Type
Stand Alone Second
Purchase Details
Closed on
Jun 23, 2005
Sold by
Centex Homes
Bought by
D R Horton Inc
Create a Home Valuation Report for This Property
The Home Valuation Report is an in-depth analysis detailing your home's value as well as a comparison with similar homes in the area
Home Values in the Area
Average Home Value in this Area
Purchase History
| Date | Buyer | Sale Price | Title Company |
|---|---|---|---|
| Linda Cook Trust | -- | None Listed On Document | |
| Cook Linda | -- | Integrated Title Ins Svcs | |
| Cook Daniel | -- | Surety Title | |
| D R Horton Inc | -- | Us Title Of Utah |
Source: Public Records
Mortgage History
| Date | Status | Borrower | Loan Amount |
|---|---|---|---|
| Previous Owner | Cook Linda | $172,000 | |
| Previous Owner | Cook Daniel | $76,251 | |
| Previous Owner | Cook Daniel | $305,004 |
Source: Public Records
Tax History
| Year | Tax Paid | Tax Assessment Tax Assessment Total Assessment is a certain percentage of the fair market value that is determined by local assessors to be the total taxable value of land and additions on the property. | Land | Improvement |
|---|---|---|---|---|
| 2025 | $3,603 | $659,100 | $157,900 | $501,200 |
| 2024 | $3,603 | $623,600 | $152,400 | $471,200 |
| 2023 | $3,552 | $579,600 | $133,700 | $445,900 |
| 2022 | $3,706 | $593,200 | $131,100 | $462,100 |
| 2021 | $3,125 | $445,400 | $101,000 | $344,400 |
| 2020 | $3,000 | $398,600 | $101,000 | $297,600 |
| 2019 | $2,964 | $387,200 | $101,000 | $286,200 |
| 2016 | $2,663 | $320,300 | $94,200 | $226,100 |
Source: Public Records
Map
Nearby Homes
- 13578 S Buckeye View Way
- 13626 S Bluewing Way
- 6652 13400 S
- 13397 S Alto Vista Ln
- 13392 S Alto Vista Ln
- 13377 S Vitasol Ln
- 13597 S Firetip Ct
- 5157 Gossamer Way
- 13343 S Fallowfield Ln
- 13324 S Ashurst Ln
- 13503 S Leaf Wing Ln
- 5149 W Arley Ct
- 5371 W Rochdale Ln
- 5168 W Shady Park Ln
- 13534 S Skipperling Ln
- 5199 W Cranford St Unit 14
- 13337 Copper Park Dr
- 4869 W Anise St
- 5612 W High Spirit Ct
- 13830 S Little Water Peak Dr
- 13544 Crimson Patch Way
- 13556 Crimson Patch Way
- 13556 S Crimson Patch Way
- 13547 S Crimson Patch Way
- 13547 Crimson Patch Way
- 13557 Crimson Patch Way
- 13557 S Crimson Patch Way
- 13564 S Crimson Patch Way
- 13538 S Crimson Patch Way
- 13564 Crimson Patch Way
- 13538 Crimson Patch Way
- 13541 Crimson Patch Way
- 13541 S Crimson Patch Way
- 13561 Crimson Patch Way
- 13561 S Crimson Patch Way
- 13537 Crimson Patch Way
- 13537 S Crimson Patch Way
- 13572 S Buckeye View Way
- 13532 Crimson Patch Way
- 13532 S Crimson Patch Way
Your Personal Tour Guide
Ask me questions while you tour the home.