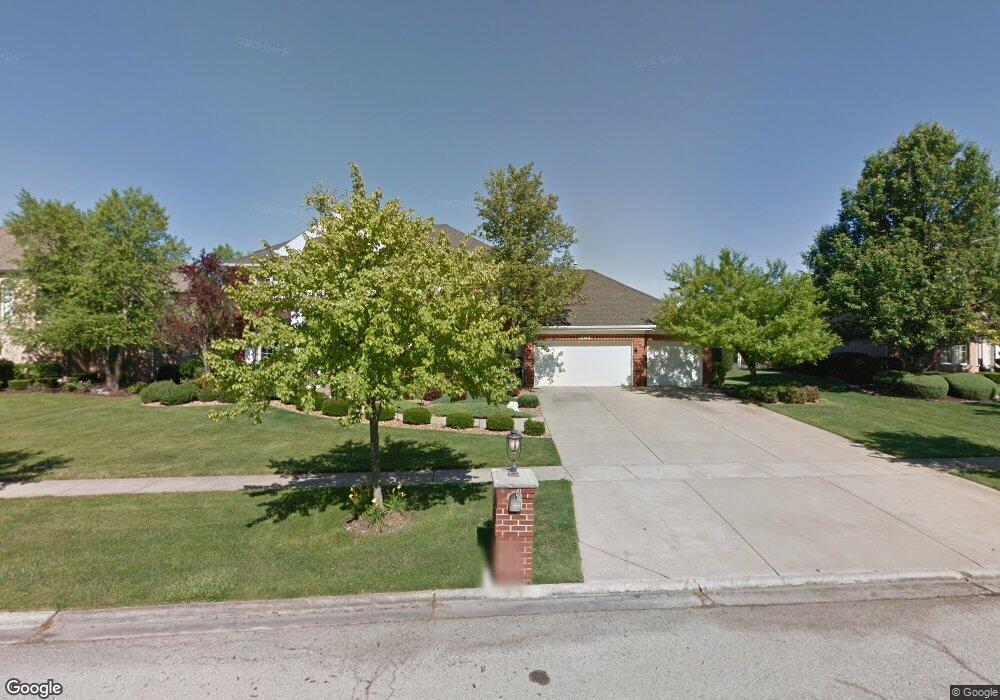
13549 Turnberry Ln Orland Park, IL 60467
Estimated Value: $698,000 - $879,000
5
Beds
5
Baths
3,539
Sq Ft
$223/Sq Ft
Est. Value
About This Home
This home is located at 13549 Turnberry Ln, Orland Park, IL 60467 and is currently estimated at $787,878, approximately $222 per square foot. 13549 Turnberry Ln is a home located in Will County with nearby schools including Goodings Grove School, Hadley Middle School, and Homer Jr High School.
Ownership History
Date
Name
Owned For
Owner Type
Purchase Details
Closed on
Mar 7, 2025
Sold by
Kane Shawn M and Kane Julie T
Bought by
Shawn M Kane Revocable Living Trust and Julie T Kane Revocable Living Trust
Current Estimated Value
Purchase Details
Closed on
Jul 30, 2010
Sold by
Prunsky Kevin P and Prunsky Barbara L
Bought by
Kane Shawn M and Kane Julie T
Home Financials for this Owner
Home Financials are based on the most recent Mortgage that was taken out on this home.
Original Mortgage
$400,000
Interest Rate
4.7%
Mortgage Type
New Conventional
Purchase Details
Closed on
Oct 14, 1997
Sold by
Standard Bank & Trust Company
Bought by
Prunsky Kevin P and Prunsky Barbara L
Home Financials for this Owner
Home Financials are based on the most recent Mortgage that was taken out on this home.
Original Mortgage
$370,000
Interest Rate
7%
Purchase Details
Closed on
May 3, 1994
Sold by
Edgewood Bank
Bought by
Standard Bank & Trust Company
Create a Home Valuation Report for This Property
The Home Valuation Report is an in-depth analysis detailing your home's value as well as a comparison with similar homes in the area
Home Values in the Area
Average Home Value in this Area
Purchase History
| Date | Buyer | Sale Price | Title Company |
|---|---|---|---|
| Shawn M Kane Revocable Living Trust | -- | None Listed On Document | |
| Kane Shawn M | $580,000 | Fidelity National Title | |
| Prunsky Kevin P | $420,000 | -- | |
| Standard Bank & Trust Company | -- | -- |
Source: Public Records
Mortgage History
| Date | Status | Borrower | Loan Amount |
|---|---|---|---|
| Previous Owner | Kane Shawn M | $400,000 | |
| Previous Owner | Prunsky Kevin P | $370,000 |
Source: Public Records
Tax History Compared to Growth
Tax History
| Year | Tax Paid | Tax Assessment Tax Assessment Total Assessment is a certain percentage of the fair market value that is determined by local assessors to be the total taxable value of land and additions on the property. | Land | Improvement |
|---|---|---|---|---|
| 2024 | $18,349 | $264,769 | $40,124 | $224,645 |
| 2023 | $18,349 | $240,001 | $36,371 | $203,630 |
| 2022 | $17,659 | $224,091 | $33,960 | $190,131 |
| 2021 | $15,910 | $212,308 | $32,174 | $180,134 |
| 2020 | $15,976 | $204,496 | $30,990 | $173,506 |
| 2019 | $15,515 | $196,725 | $29,812 | $166,913 |
| 2018 | $15,085 | $189,266 | $29,470 | $159,796 |
| 2017 | $14,819 | $183,968 | $28,645 | $155,323 |
| 2016 | $14,471 | $177,833 | $27,690 | $150,143 |
| 2015 | $13,499 | $171,158 | $26,651 | $144,507 |
| 2014 | $13,499 | $163,291 | $27,302 | $135,989 |
| 2013 | $13,499 | $163,291 | $27,302 | $135,989 |
Source: Public Records
Map
Nearby Homes
- 12444 Lake View Dr
- 12657 Lake View Dr
- 13926 S Addison Trail
- 12032 Lake View Dr
- 12009 Venetian Way
- 14017 S Belmont Dr
- 14019 S Belmont Dr
- 14042 Churchill Dr
- 13626 Overland Trail
- 13547 Lost Boy Ln
- Fremont Plan at Goodings Grove
- Eden Plan at Goodings Grove
- Danbury Plan at Goodings Grove
- Calysta Plan at Goodings Grove
- Briarcliffe Plan at Goodings Grove
- Amberwood Plan at Goodings Grove
- 12360 Derby Ln
- 13650 Old Post Rd
- 13017 W Hiawatha Dr
- 13124 W Beaver Lake Dr
- 13539 Turnberry Ln
- 13557 Turnberry Ln
- 12410 Anand Brook Dr
- 13529 Turnberry Ln
- 12406 Anand Brook Dr
- 12416 Anand Brook Dr
- 12462 Anand Brook Dr
- 12505 Lake View Dr
- 13548 Turnberry Ln
- 12516 Anand Brook Dr
- 12431 Lake View Dr
- 12422 Anand Brook Dr
- 12430 Anand Brook Dr
- 12521 Lake View Dr
- 12444 Anand Brook Dr
- 12528 Anand Brook Dr
- 12456 Lake View Dr
- 12505 Anand Brook Dr
- 12500 Lake View Dr
- 12411 Anand Brook Dr