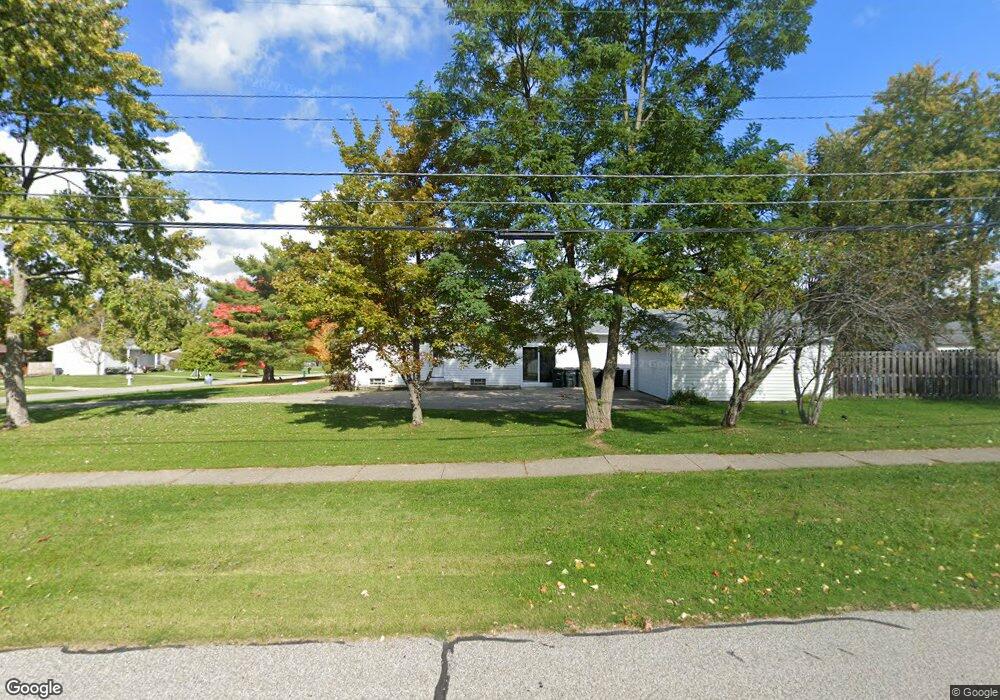
13549 Yager Dr Strongsville, OH 44149
Estimated Value: $317,000 - $339,349
4
Beds
3
Baths
1,976
Sq Ft
$165/Sq Ft
Est. Value
About This Home
This home is located at 13549 Yager Dr, Strongsville, OH 44149 and is currently estimated at $326,337, approximately $165 per square foot. 13549 Yager Dr is a home located in Cuyahoga County with nearby schools including Strongsville High School, Strongsville Academy, and Sts Joseph & John Interparochial School.
Ownership History
Date
Name
Owned For
Owner Type
Purchase Details
Closed on
Oct 3, 2017
Sold by
Martin Norm and Martin Jeannie
Bought by
Stracovic Jessica S
Current Estimated Value
Purchase Details
Closed on
Dec 12, 2011
Sold by
Disisto Properties Llc and Aceto Enzo
Bought by
Martin Jeanie and Martin Norm
Purchase Details
Closed on
Sep 21, 2010
Sold by
The Bank Of New York Mellon Trust Compan
Bought by
Disisto Properties Llc and Aceto Enzo
Purchase Details
Closed on
Jul 20, 2010
Sold by
Strange Pamela L
Bought by
The Bank Of New York Mellon Trust Compan
Purchase Details
Closed on
Feb 28, 1991
Sold by
Goulder Richard A
Bought by
Strange Roy G
Purchase Details
Closed on
Apr 4, 1984
Sold by
Spirnak Mary F
Bought by
Goulder Richard A
Purchase Details
Closed on
Aug 27, 1981
Sold by
Spirnak Mary F
Bought by
Dickens Invest Co
Purchase Details
Closed on
Jan 1, 1975
Bought by
Spirnak Mary F
Create a Home Valuation Report for This Property
The Home Valuation Report is an in-depth analysis detailing your home's value as well as a comparison with similar homes in the area
Home Values in the Area
Average Home Value in this Area
Purchase History
| Date | Buyer | Sale Price | Title Company |
|---|---|---|---|
| Stracovic Jessica S | -- | None Available | |
| Martin Jeanie | $155,000 | Maximum Title | |
| Disisto Properties Llc | $80,000 | Accutitle Agency | |
| The Bank Of New York Mellon Trust Compan | $95,200 | Attorney | |
| Strange Roy G | $77,000 | -- | |
| Goulder Richard A | $53,000 | -- | |
| Spirnak Mary F | -- | -- | |
| Dickens Invest Co | $47,000 | -- | |
| Spirnak Mary F | -- | -- |
Source: Public Records
Tax History Compared to Growth
Tax History
| Year | Tax Paid | Tax Assessment Tax Assessment Total Assessment is a certain percentage of the fair market value that is determined by local assessors to be the total taxable value of land and additions on the property. | Land | Improvement |
|---|---|---|---|---|
| 2024 | $4,485 | $95,515 | $14,665 | $80,850 |
| 2023 | $4,042 | $64,550 | $15,300 | $49,250 |
| 2022 | $4,012 | $64,540 | $15,300 | $49,250 |
| 2021 | $3,981 | $64,540 | $15,300 | $49,250 |
| 2020 | $3,687 | $52,890 | $12,530 | $40,360 |
| 2019 | $3,579 | $151,100 | $35,800 | $115,300 |
| 2018 | $3,248 | $52,890 | $12,530 | $40,360 |
| 2017 | $3,313 | $48,690 | $10,680 | $38,010 |
| 2016 | $3,287 | $48,690 | $10,680 | $38,010 |
| 2015 | $3,235 | $48,690 | $10,680 | $38,010 |
| 2014 | $3,235 | $47,250 | $10,360 | $36,890 |
Source: Public Records
Map
Nearby Homes
- 13236 Tomson Dr
- 12651 Alameda Dr
- 12694 Ionia Ct
- 12647 Edgepark Cir
- 20078 Trapper Trail
- 13156 Olympus Way
- 14112 Settlers Way
- 14400 Prospect Rd
- 19620 Porters Ln Unit 15F
- 13066 Olympus Way
- 13099 Olympus Way
- 12385 Corinth Ct
- 12539 Olympus Way
- 22125 Olde Creek Trail
- 14896 Britannia Ct
- 15017 Regency Dr
- 14890 Prospect Rd
- 19160 Wheelers Ln
- 22235 North Trail
- 15001 Scarlet Oak Trail
- 13505 Yager Dr
- 13463 Yager Dr
- 13548 Tomson Dr
- 13504 Tomson Dr
- 20407 Westwood Park Blvd
- 20399 Westwood Park Blvd
- 20435 Westwood Park Blvd
- 13548 Yager Dr
- 13462 Tomson Dr
- 20367 Westwood Park Blvd
- 13419 Yager Dr
- 13466 Yager Dr
- 20465 Westwood Park Blvd
- 13462 Yager Dr
- 20337 Westwood Park Blvd
- 13418 Tomson Dr
- 13375 Yager Dr
- 13418 Yager Dr
- 20307 Westwood Park Blvd
- 13374 Tomson Dr