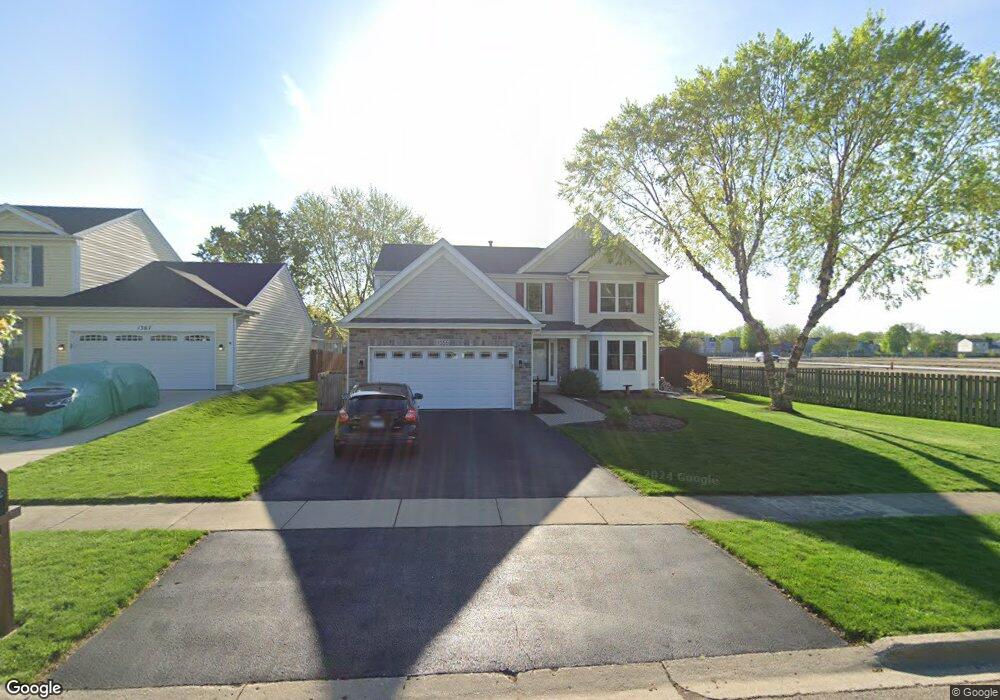
1355 Hidden Oaks Dr Unit 2 Aurora, IL 60506
Edgelawn Randall NeighborhoodEstimated Value: $381,000 - $428,000
4
Beds
4
Baths
2,340
Sq Ft
$170/Sq Ft
Est. Value
About This Home
This home is located at 1355 Hidden Oaks Dr Unit 2, Aurora, IL 60506 and is currently estimated at $397,253, approximately $169 per square foot. 1355 Hidden Oaks Dr Unit 2 is a home located in Kane County with nearby schools including Smith Elementary School, Jewel Middle School, and West Aurora High School.
Ownership History
Date
Name
Owned For
Owner Type
Purchase Details
Closed on
Feb 6, 2002
Sold by
Relocation Resources International Inc
Bought by
Verdick Gale D and Verdick Stacy L
Current Estimated Value
Home Financials for this Owner
Home Financials are based on the most recent Mortgage that was taken out on this home.
Original Mortgage
$145,000
Outstanding Balance
$59,362
Interest Rate
6.92%
Estimated Equity
$337,891
Purchase Details
Closed on
Feb 1, 2002
Sold by
Shaw Vincent K and Ucar Shaw Berin S
Bought by
Relocation Resources International Inc
Home Financials for this Owner
Home Financials are based on the most recent Mortgage that was taken out on this home.
Original Mortgage
$145,000
Outstanding Balance
$59,362
Interest Rate
6.92%
Estimated Equity
$337,891
Create a Home Valuation Report for This Property
The Home Valuation Report is an in-depth analysis detailing your home's value as well as a comparison with similar homes in the area
Home Values in the Area
Average Home Value in this Area
Purchase History
| Date | Buyer | Sale Price | Title Company |
|---|---|---|---|
| Verdick Gale D | $195,000 | Greater Illinois Title Compa | |
| Relocation Resources International Inc | $195,000 | Greater Illinois Title Compa |
Source: Public Records
Mortgage History
| Date | Status | Borrower | Loan Amount |
|---|---|---|---|
| Open | Verdick Gale D | $145,000 |
Source: Public Records
Tax History Compared to Growth
Tax History
| Year | Tax Paid | Tax Assessment Tax Assessment Total Assessment is a certain percentage of the fair market value that is determined by local assessors to be the total taxable value of land and additions on the property. | Land | Improvement |
|---|---|---|---|---|
| 2024 | $8,601 | $116,625 | $18,563 | $98,062 |
| 2023 | $8,240 | $104,204 | $16,586 | $87,618 |
| 2022 | $7,819 | $94,327 | $15,133 | $79,194 |
| 2021 | $7,475 | $87,820 | $14,089 | $73,731 |
| 2020 | $7,538 | $86,518 | $13,087 | $73,431 |
| 2019 | $7,252 | $80,161 | $12,125 | $68,036 |
| 2018 | $7,208 | $78,206 | $11,215 | $66,991 |
| 2017 | $7,183 | $75,798 | $10,334 | $65,464 |
| 2016 | $7,005 | $71,938 | $8,858 | $63,080 |
| 2015 | -- | $62,569 | $7,617 | $54,952 |
| 2014 | -- | $58,220 | $7,326 | $50,894 |
| 2013 | -- | $59,320 | $7,221 | $52,099 |
Source: Public Records
Map
Nearby Homes
- 1532 Golden Oaks Pkwy
- 910 Southbridge Dr
- 1035 Newcastle Ln
- 972 Westgate Dr
- 833 N Randall Rd Unit C4
- 1389 Monomoy St Unit B2
- 1351 Monomoy St Unit D
- 795 N Elmwood Dr
- 781 N Elmwood Dr
- 1815 Brighton Cir
- 967 Sapphire Ln
- 959 Sapphire Ln
- 963 Sapphire Ln
- 1104 New Haven Ave
- 960 Sapphire Ln
- 964 Sapphire Ln
- 740 N Elmwood Dr
- 742 N Glenwood Place
- 1120 Emerald Dr
- 1475 Elder Dr
- 1367 Hidden Oaks Dr
- 1174 Red Oak Trail
- 1379 Hidden Oaks Dr
- 1300 Big Oak Trail
- 1170 Red Oak Trail Unit 3
- 1178 Red Oak Trail
- 1391 Hidden Oaks Dr
- 1304 Big Oak Trail
- 1301 Big Oak Trail
- 1166 Red Oak Trail Unit 3
- 1182 Red Oak Trail
- 1472 Golden Oaks Pkwy
- 1308 Big Oak Trail
- 1305 Big Oak Trail
- 1162 Red Oak Trail
- 1186 Red Oak Trail
- 1476 Golden Oaks Pkwy
- 1309 Big Oak Trail
- 1312 Big Oak Trail Unit 2
- 1480 Golden Oaks Pkwy