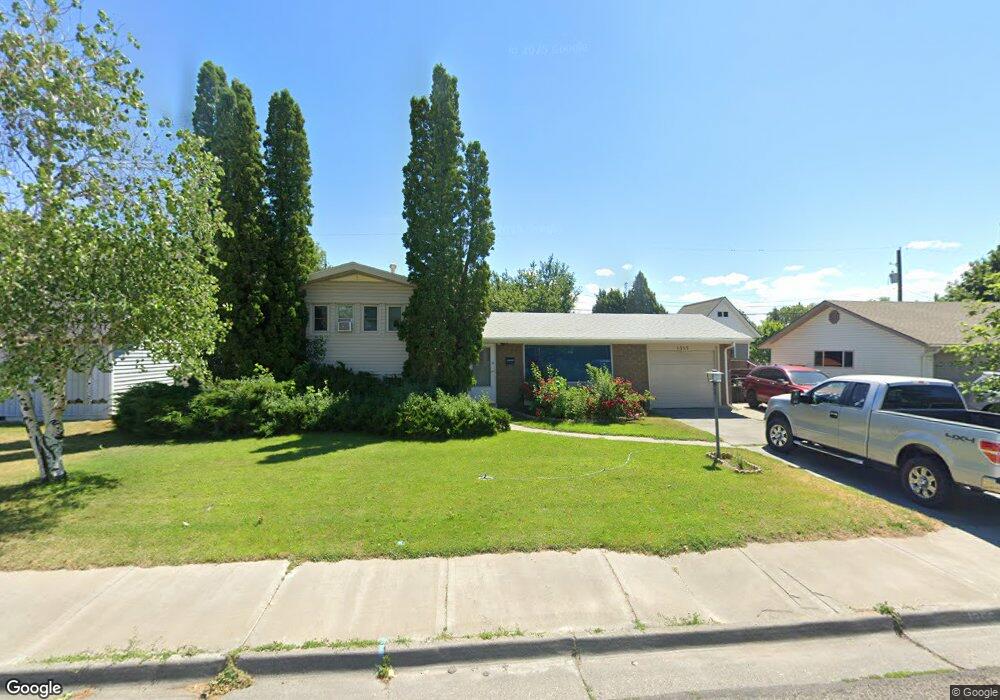
1355 Merrett Dr Idaho Falls, ID 83404
Estimated Value: $295,000 - $316,000
3
Beds
3
Baths
1,645
Sq Ft
$186/Sq Ft
Est. Value
About This Home
This home is located at 1355 Merrett Dr, Idaho Falls, ID 83404 and is currently estimated at $305,855, approximately $185 per square foot. 1355 Merrett Dr is a home located in Bonneville County with nearby schools including Theresa Bunker Elementary School, Taylorview Middle School, and Idaho Falls Senior High School.
Ownership History
Date
Name
Owned For
Owner Type
Purchase Details
Closed on
Aug 19, 2015
Sold by
Morris John Clay K and Wharton Morris Denise E
Bought by
Wharton Morris Denise E
Current Estimated Value
Home Financials for this Owner
Home Financials are based on the most recent Mortgage that was taken out on this home.
Original Mortgage
$67,000
Outstanding Balance
$52,587
Interest Rate
3.97%
Mortgage Type
New Conventional
Estimated Equity
$253,268
Purchase Details
Closed on
Aug 17, 2015
Sold by
Reay Jennifer
Bought by
Wharton Morris Denise Elaine
Home Financials for this Owner
Home Financials are based on the most recent Mortgage that was taken out on this home.
Original Mortgage
$67,000
Outstanding Balance
$52,587
Interest Rate
3.97%
Mortgage Type
New Conventional
Estimated Equity
$253,268
Purchase Details
Closed on
Jan 15, 2014
Sold by
Leavitt Andrea Michelle
Bought by
Leavitt Andrea Michelle and Wharton Morris Denise Elaine
Create a Home Valuation Report for This Property
The Home Valuation Report is an in-depth analysis detailing your home's value as well as a comparison with similar homes in the area
Home Values in the Area
Average Home Value in this Area
Purchase History
| Date | Buyer | Sale Price | Title Company |
|---|---|---|---|
| Wharton Morris Denise E | -- | None Available | |
| Wharton Morris Denise Elaine | -- | First American Title | |
| Wharton Morris Denise Elaine | -- | First American Title | |
| Wharton Morris Denise Elaine | -- | First American Title | |
| Leavitt Andrea Michelle | -- | None Available |
Source: Public Records
Mortgage History
| Date | Status | Borrower | Loan Amount |
|---|---|---|---|
| Open | Wharton Morris Denise E | $67,000 |
Source: Public Records
Tax History Compared to Growth
Tax History
| Year | Tax Paid | Tax Assessment Tax Assessment Total Assessment is a certain percentage of the fair market value that is determined by local assessors to be the total taxable value of land and additions on the property. | Land | Improvement |
|---|---|---|---|---|
| 2025 | $2,712 | $363,982 | $71,556 | $292,426 |
| 2024 | $2,712 | $329,776 | $49,328 | $280,448 |
| 2023 | $2,621 | $278,508 | $49,328 | $229,180 |
| 2022 | $2,752 | $229,019 | $31,969 | $197,050 |
| 2021 | $2,752 | $171,209 | $31,969 | $139,240 |
| 2019 | $2,245 | $130,986 | $26,636 | $104,350 |
| 2018 | $2,030 | $125,515 | $24,215 | $101,300 |
| 2017 | $1,860 | $107,621 | $17,611 | $90,010 |
| 2016 | $1,754 | $99,511 | $16,021 | $83,490 |
| 2015 | $1,682 | $89,541 | $16,021 | $73,520 |
| 2014 | $30,713 | $89,541 | $16,021 | $73,520 |
| 2013 | $1,677 | $92,141 | $16,021 | $76,120 |
Source: Public Records
Map
Nearby Homes
- 1480 Merrett Dr
- 1571 Palm Springs Dr
- 1473 Austin Ave
- 1307 Laurel Dr
- 1260 E 17th St
- 1185 S 15th E
- 1875 Mckinzie Ave
- 1367 Homer Ave
- 1896 Jeppson Ave
- 1916 Mckinzie Ave
- 1020 Koster Ave
- 1617 9th St
- 1316 S Woodruff Ave
- 1840 Sequoia Dr
- TBD N 15th E
- 900 Stanger Ave
- 884 E 13th St
- 1801 E 16th St
- 967 S Woodruff Ave
- 1044 Westergard Ave
- 1315 Merrett Dr
- 1365 Merrett Dr
- 1330 Merrett Dr
- 1305 Merrett Dr
- 1310 Merrett Dr
- 1370 Merrett Dr
- 1370 Merrett Dr
- 1385 Merrett Dr
- 1300 Merrett Dr
- 1380 Merrett Dr
- 1285 Merrett Dr
- 1343 Tower St
- 1280 Orlin Dr
- 1280 Merrett Dr
- 1375 Bower Dr
- 1315 Tower St
- 1265 Merrett Dr
- 1335 Bower Dr
- 1260 Orlin Dr
- 1315 Bower Dr