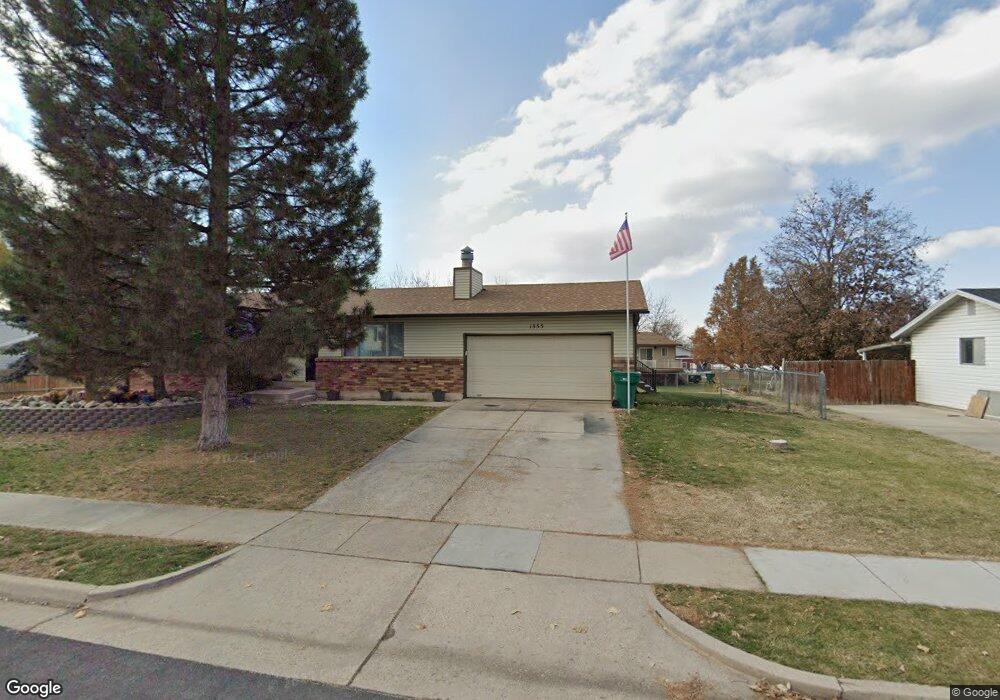
1355 N Nayon Dr Layton, UT 84040
Estimated Value: $493,000 - $502,000
4
Beds
2
Baths
2,592
Sq Ft
$192/Sq Ft
Est. Value
About This Home
This home is located at 1355 N Nayon Dr, Layton, UT 84040 and is currently estimated at $497,060, approximately $191 per square foot. 1355 N Nayon Dr is a home located in Davis County with nearby schools including King Elementary School, Central Davis Junior High School, and Layton High School.
Ownership History
Date
Name
Owned For
Owner Type
Purchase Details
Closed on
Aug 31, 2016
Sold by
Rocheal Alexsandria Barb Tr
Bought by
Hoffman Stuart William and Hoffman Karen Camille
Current Estimated Value
Purchase Details
Closed on
Apr 4, 2008
Sold by
Morse David M and Morse Terry L
Bought by
Morse David Mckay and Morse Terry Lynne
Purchase Details
Closed on
Sep 21, 2007
Sold by
Morse David M
Bought by
Morse David M and Morse Terry L
Purchase Details
Closed on
Sep 21, 1998
Sold by
Morse David M
Bought by
Morse David M
Home Financials for this Owner
Home Financials are based on the most recent Mortgage that was taken out on this home.
Original Mortgage
$71,913
Interest Rate
6.88%
Mortgage Type
VA
Create a Home Valuation Report for This Property
The Home Valuation Report is an in-depth analysis detailing your home's value as well as a comparison with similar homes in the area
Home Values in the Area
Average Home Value in this Area
Purchase History
| Date | Buyer | Sale Price | Title Company |
|---|---|---|---|
| Hoffman Stuart William | -- | Security Title | |
| Hoffman Stuart William | -- | Security Title | |
| Morse David Mckay | -- | None Available | |
| Morse David M | -- | None Available | |
| Morse David M | -- | Associated Title Company |
Source: Public Records
Mortgage History
| Date | Status | Borrower | Loan Amount |
|---|---|---|---|
| Previous Owner | Morse David M | $71,913 |
Source: Public Records
Tax History
| Year | Tax Paid | Tax Assessment Tax Assessment Total Assessment is a certain percentage of the fair market value that is determined by local assessors to be the total taxable value of land and additions on the property. | Land | Improvement |
|---|---|---|---|---|
| 2025 | $2,442 | $256,300 | $118,147 | $138,153 |
| 2024 | $2,335 | $246,949 | $143,037 | $103,912 |
| 2023 | $2,307 | $236,500 | $107,408 | $129,091 |
| 2022 | $2,440 | $449,000 | $190,068 | $258,932 |
| 2021 | $2,252 | $340,000 | $158,754 | $181,246 |
| 2020 | $1,947 | $282,000 | $127,193 | $154,807 |
| 2019 | $1,925 | $273,000 | $113,913 | $159,087 |
| 2018 | $1,756 | $250,000 | $87,635 | $162,365 |
| 2016 | $1,575 | $115,720 | $46,342 | $69,378 |
| 2015 | $1,517 | $105,820 | $46,342 | $59,478 |
| 2014 | $1,478 | $105,395 | $46,342 | $59,053 |
| 2013 | $1,400 | $94,522 | $22,748 | $71,774 |
Source: Public Records
Map
Nearby Homes
- 1258 E North Lisa St
- 1048 E Cherry Ln
- 1340 E Hollyhock Way
- 1252 E Larkspur Way
- 1354 E Hollyhock Way
- 1266 E Larkspur Way
- 1305 E Larkspur Way
- 1156 Cherrywood Dr
- 1476 Kays Creek Dr
- 1033 E 825 N
- 1920 N Camellia Way Unit 406
- 1545 E 975 N
- 1930 N Camellia Way E Unit 407
- 997 E 825 N
- 1465 E Sego Lily Ct
- 1540 E Primrose Ln
- 1148 N 1875 E Unit 2
- 1843 Hayes Dr
- 1099 E 2125 N
- 2096 N 1450 E
- 1355 Nayon Dr
- 1377 Nayon Dr
- 1203 E 1350 N
- 1341 N Nayon Dr
- 1340 N 1200 E
- 1341 Nayon Dr
- 1336 N 1225 E
- 1222 E North Lisa St
- 1228 E 1375 N
- 1220 E Cherry Ln
- 1336 Nayon Dr
- 1391 Nayon Dr
- 1330 N 1200 E
- 1325 N Nayon Dr
- 1235 E North Lisa St
- 1200 E Cherry Ln
- 1181 E 1350 N
- 1325 Nayon Dr
- 1328 Nayon Dr
- 1388 Nayon Dr
Your Personal Tour Guide
Ask me questions while you tour the home.