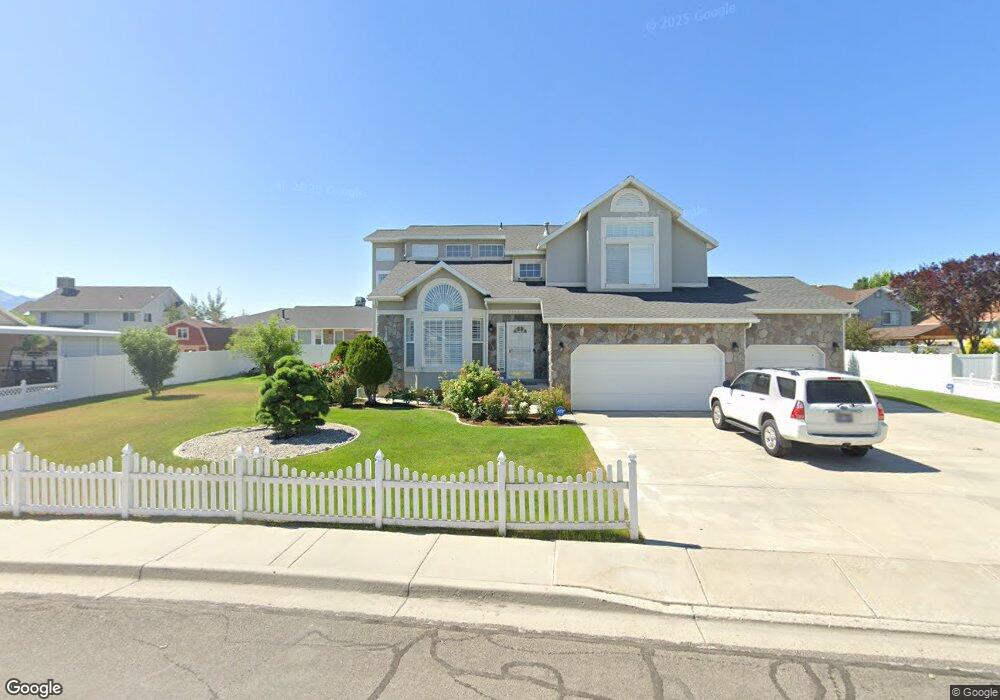
1355 W Kingspointe Ln West Valley City, UT 84119
Redwood NeighborhoodEstimated Value: $614,000 - $795,000
5
Beds
4
Baths
3,308
Sq Ft
$206/Sq Ft
Est. Value
About This Home
This home is located at 1355 W Kingspointe Ln, West Valley City, UT 84119 and is currently estimated at $681,902, approximately $206 per square foot. 1355 W Kingspointe Ln is a home located in Salt Lake County with nearby schools including Granger Elementary School, Valley Junior High School, and Granger High School.
Ownership History
Date
Name
Owned For
Owner Type
Purchase Details
Closed on
Oct 31, 2016
Bought by
Bach Terry
Current Estimated Value
Home Financials for this Owner
Home Financials are based on the most recent Mortgage that was taken out on this home.
Original Mortgage
$204,000
Outstanding Balance
$164,034
Interest Rate
3.47%
Estimated Equity
$517,868
Purchase Details
Closed on
Aug 14, 2012
Sold by
Vu Khoi D and Nguyen Ha Hai
Bought by
Bach Terrry and Bach Bing
Purchase Details
Closed on
Jun 25, 2012
Sold by
Nguyen Hung P and Vu Khoi D
Bought by
Vu Khoi D and Nguyen Hai Hai
Purchase Details
Closed on
Jun 2, 1997
Sold by
Ivory Homes
Bought by
Nguyen Hung P and Vu Khoi D
Home Financials for this Owner
Home Financials are based on the most recent Mortgage that was taken out on this home.
Original Mortgage
$154,100
Interest Rate
8.13%
Mortgage Type
Purchase Money Mortgage
Create a Home Valuation Report for This Property
The Home Valuation Report is an in-depth analysis detailing your home's value as well as a comparison with similar homes in the area
Home Values in the Area
Average Home Value in this Area
Purchase History
| Date | Buyer | Sale Price | Title Company |
|---|---|---|---|
| Bach Terry | -- | -- | |
| Bach Terrry | -- | Surety Title | |
| Vu Khoi D | -- | Surety Title | |
| Nguyen Hung P | -- | -- |
Source: Public Records
Mortgage History
| Date | Status | Borrower | Loan Amount |
|---|---|---|---|
| Open | Bach Terry | $204,000 | |
| Closed | Bach Terry | -- | |
| Previous Owner | Nguyen Hung P | $154,100 |
Source: Public Records
Tax History Compared to Growth
Tax History
| Year | Tax Paid | Tax Assessment Tax Assessment Total Assessment is a certain percentage of the fair market value that is determined by local assessors to be the total taxable value of land and additions on the property. | Land | Improvement |
|---|---|---|---|---|
| 2025 | $3,922 | $635,500 | $147,000 | $488,500 |
| 2024 | $3,922 | $600,900 | $139,700 | $461,200 |
| 2023 | $3,819 | $560,100 | $134,300 | $425,800 |
| 2022 | $3,869 | $569,100 | $131,700 | $437,400 |
| 2021 | $3,458 | $457,100 | $101,300 | $355,800 |
| 2020 | $3,195 | $398,600 | $92,100 | $306,500 |
| 2019 | $3,258 | $392,000 | $92,100 | $299,900 |
| 2018 | $3,135 | $363,500 | $92,100 | $271,400 |
| 2017 | $2,863 | $337,700 | $89,000 | $248,700 |
| 2016 | $2,672 | $315,700 | $89,000 | $226,700 |
| 2015 | $2,546 | $286,400 | $87,300 | $199,100 |
| 2014 | $2,492 | $274,700 | $84,600 | $190,100 |
Source: Public Records
Map
Nearby Homes
- 3858 Congress Dr
- 3731 S Fisher Way
- 1511 W Leonardo Ln Unit A
- 1268 W Chickadee St Unit 61
- 3842 S Clare Dr Unit D-1
- 3821 S Kingsbury Ln Unit B2
- 3680 S Meadow Stream Rd
- 1265 W Goldfinch St
- 1513 W Kingsbarn Way
- 3699 Angelico Ct Unit D
- 1209 W Meadow Stream Rd Unit 67
- 3599 S 1365 W
- 1521 Kinloch Way
- 3888 S 1530 W Unit 240
- 1547 W Kinloch Way
- 1195 River Bank Rd
- 1183 Parkway Ln
- 1461 W Parliament Ave
- 1573 W Kinloch Way
- 1587 W Kinloch Way
- 1355 Kingspointe Ln
- 1337 Kingspointe Ln
- 1360 W 3815 S
- 1348 W 3815 S
- 1372 W 3815 S
- 1356 W Kingspointe Ln
- 1356 Kingspointe Ln
- 1369 Kingspointe Ln
- 3778 Kingspointe Cir
- 1334 W 3815 S
- 3771 Queenspointe Ln
- 1390 W 3815 S
- 1313 Kingspointe Ln
- 3783 Queenspointe Cir
- 3763 Kingspointe Cir
- 3805 Emperor Dr
- 3768 S Kingspointe Cir
- 1351 W 3815 S
- 3826 Emperor Dr
- 1365 W 3815 S