1356 W 1100 S Clearfield, UT 84015
Estimated Value: $533,000 - $590,621
3
Beds
2
Baths
3,384
Sq Ft
$168/Sq Ft
Est. Value
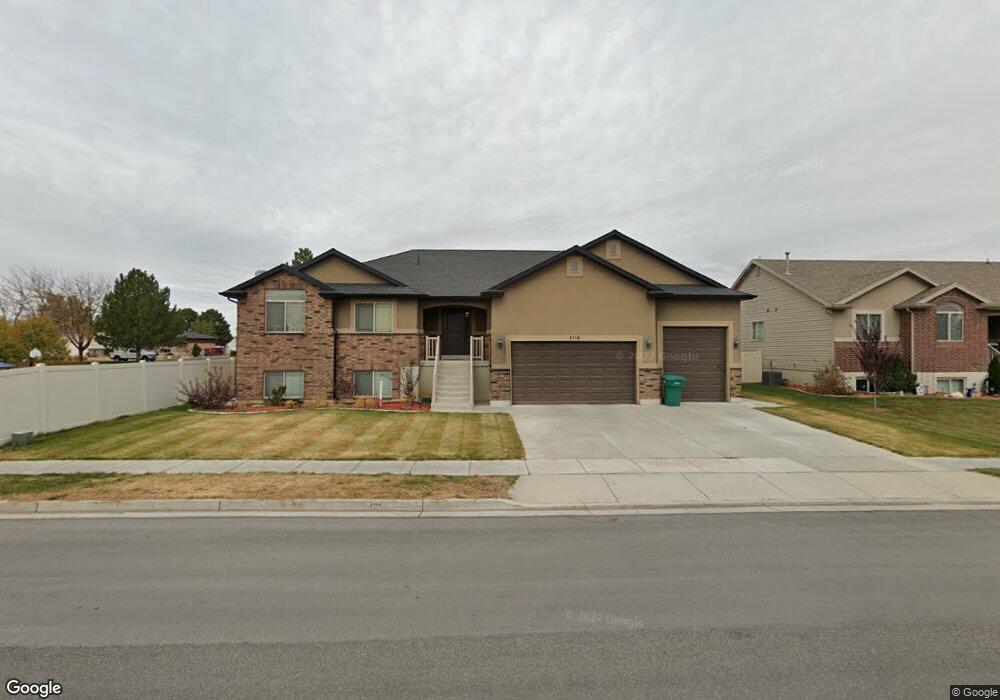
About This Home
This home is located at 1356 W 1100 S, Clearfield, UT 84015 and is currently estimated at $570,155, approximately $168 per square foot. 1356 W 1100 S is a home located in Davis County with nearby schools including Cook School, Syracuse Junior High School, and Syracuse High School.
Ownership History
Date
Name
Owned For
Owner Type
Purchase Details
Closed on
Aug 20, 2024
Sold by
Morado Michael A
Bought by
First-Generation Trust and Morado
Current Estimated Value
Purchase Details
Closed on
Aug 2, 2010
Sold by
Elkridge Construction Inc
Bought by
Morado Michael A
Home Financials for this Owner
Home Financials are based on the most recent Mortgage that was taken out on this home.
Original Mortgage
$241,500
Interest Rate
4.71%
Mortgage Type
VA
Purchase Details
Closed on
Jun 24, 2010
Sold by
Tanner Heritage Llc
Bought by
Elkridge Construction Inc
Home Financials for this Owner
Home Financials are based on the most recent Mortgage that was taken out on this home.
Original Mortgage
$241,500
Interest Rate
4.71%
Mortgage Type
VA
Purchase Details
Closed on
Mar 11, 2010
Sold by
Wells Fargo Bank National Association
Bought by
Castle Creek Homes Llc
Create a Home Valuation Report for This Property
The Home Valuation Report is an in-depth analysis detailing your home's value as well as a comparison with similar homes in the area
Home Values in the Area
Average Home Value in this Area
Purchase History
| Date | Buyer | Sale Price | Title Company |
|---|---|---|---|
| First-Generation Trust | -- | None Listed On Document | |
| Morado Michael A | -- | Mountain View Title | |
| Elkridge Construction Inc | -- | Mountain View Title | |
| Castle Creek Homes Llc | -- | First American Title Ncs |
Source: Public Records
Mortgage History
| Date | Status | Borrower | Loan Amount |
|---|---|---|---|
| Previous Owner | Morado Michael A | $241,500 |
Source: Public Records
Tax History Compared to Growth
Tax History
| Year | Tax Paid | Tax Assessment Tax Assessment Total Assessment is a certain percentage of the fair market value that is determined by local assessors to be the total taxable value of land and additions on the property. | Land | Improvement |
|---|---|---|---|---|
| 2025 | $2,763 | $299,750 | $72,093 | $227,657 |
| 2024 | $2,657 | $290,400 | $68,925 | $221,475 |
| 2023 | $2,576 | $514,000 | $110,323 | $403,677 |
| 2022 | $2,930 | $290,950 | $63,209 | $227,741 |
| 2021 | $2,540 | $394,000 | $67,057 | $326,943 |
| 2020 | $2,228 | $349,000 | $56,367 | $292,633 |
| 2019 | $2,174 | $337,000 | $59,172 | $277,828 |
| 2018 | $2,085 | $317,000 | $52,521 | $264,479 |
| 2016 | $1,803 | $147,235 | $20,970 | $126,265 |
| 2015 | $2,277 | $146,795 | $20,970 | $125,825 |
| 2014 | $1,580 | $128,034 | $20,970 | $107,064 |
| 2013 | -- | $142,630 | $30,938 | $111,692 |
Source: Public Records
Map
Nearby Homes
- 1166 Dallas St
- 817 S 1350 W
- 1121 W 1290 S
- 1384 S Melanie Ln
- 1251 S 1650 W
- 1097 W 850 S
- 1327 S 1650 W
- 1481 S Melanie Ln
- 1385 S 1100 W
- 922 S 1760 W
- 916 S 1760 W
- 587 S 1400 W
- 1466 Earl Cir
- 1154 W 1700 S
- 1622 S 1000 W
- 1876 S 1230 W
- 1153 W 1875 S Unit 223
- 4284 W 350 S Unit 615
- 4296 W 350 S Unit 614
- 2117 W 1275 S
- 1342 W 1100 S
- 1216 W 1100 S Unit 104
- 1216 W 1100 S Unit 106
- 1118 S 1375 W Unit BSMNT
- 1118 S 1375 W
- 1111 S 1325 W
- 1341 W 1045 S
- 1328 W 1100 S
- 1104 S 1325 W
- 1104 S 1325 W Unit 24
- 1138 S 1375 W Unit 49
- 1138 S 1375 W
- 1323 W 1045 S
- 1131 S 1325 W
- 1113 S 1375 W
- 1124 S 1325 W
- 1039 S 1350 W
- 1380 W 1045 S
- 1309 W 1045 S
- 1144 S 1325 W Unit 22