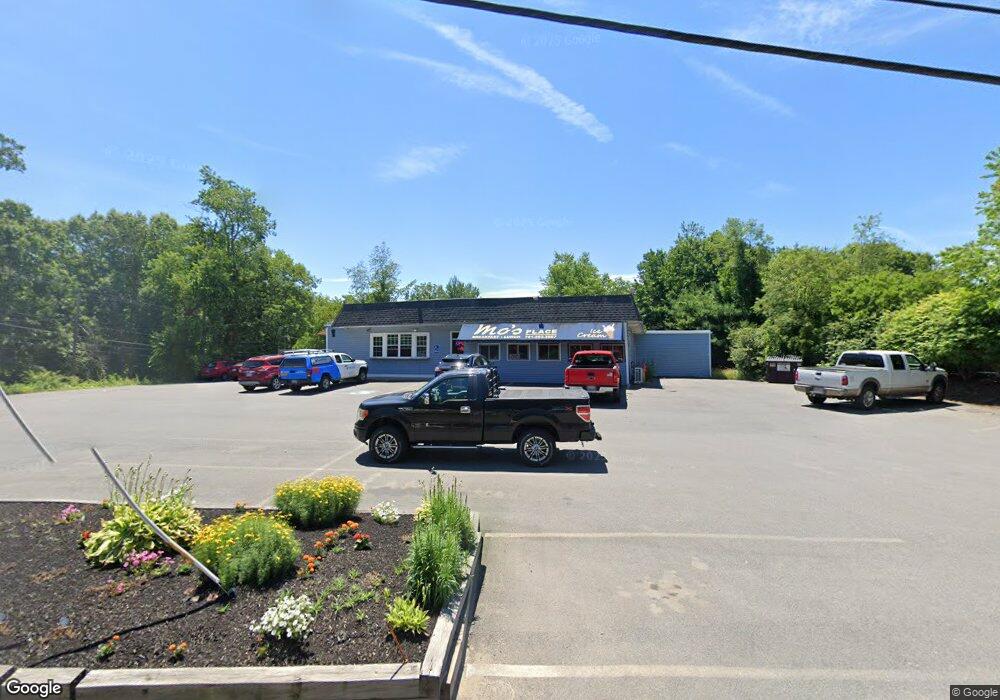
1357 Main St Unit B Hanson, MA 02341
Estimated Value: $398,474
--
Bed
1
Bath
600
Sq Ft
$664/Sq Ft
Est. Value
About This Home
This home is located at 1357 Main St Unit B, Hanson, MA 02341 and is currently estimated at $398,474, approximately $664 per square foot. 1357 Main St Unit B is a home located in Plymouth County.
Ownership History
Date
Name
Owned For
Owner Type
Purchase Details
Closed on
Aug 14, 2008
Sold by
Jannotta Kenneth and Jannotta Patricia A
Bought by
Jannotta Kenneth A
Current Estimated Value
Purchase Details
Closed on
Jan 3, 2007
Sold by
Hamilton Ft
Bought by
Jannotta Kenneth A and Jannotta Patricia A
Purchase Details
Closed on
Dec 27, 1993
Sold by
Budd Lawrence and Gredler Ann
Bought by
Pihl Walter D and Pihl Dona M
Create a Home Valuation Report for This Property
The Home Valuation Report is an in-depth analysis detailing your home's value as well as a comparison with similar homes in the area
Home Values in the Area
Average Home Value in this Area
Purchase History
| Date | Buyer | Sale Price | Title Company |
|---|---|---|---|
| Jannotta Kenneth A | -- | -- | |
| Jannotta Kenneth A | -- | -- | |
| Jannotta Kenneth A | $392,500 | -- | |
| Jannotta Kenneth A | $392,500 | -- | |
| Pihl Walter D | $112,000 | -- |
Source: Public Records
Mortgage History
| Date | Status | Borrower | Loan Amount |
|---|---|---|---|
| Open | Pihl Walter D | $35,000 | |
| Closed | Pihl Walter D | $50,000 |
Source: Public Records
Tax History Compared to Growth
Tax History
| Year | Tax Paid | Tax Assessment Tax Assessment Total Assessment is a certain percentage of the fair market value that is determined by local assessors to be the total taxable value of land and additions on the property. | Land | Improvement |
|---|---|---|---|---|
| 2025 | $7,083 | $529,400 | $193,500 | $335,900 |
| 2024 | $6,857 | $512,500 | $187,900 | $324,600 |
| 2023 | $6,923 | $488,200 | $179,000 | $309,200 |
| 2022 | $7,076 | $468,900 | $172,100 | $296,800 |
| 2021 | $6,806 | $450,700 | $167,100 | $283,600 |
| 2020 | $6,783 | $444,200 | $163,900 | $280,300 |
| 2019 | $6,788 | $437,100 | $160,200 | $276,900 |
| 2018 | $6,870 | $434,000 | $157,800 | $276,200 |
| 2017 | $6,713 | $420,100 | $154,800 | $265,300 |
| 2016 | $6,913 | $417,700 | $154,700 | $263,000 |
| 2015 | $6,639 | $417,000 | $154,700 | $262,300 |
Source: Public Records
Map
Nearby Homes
- 1139 Main St Unit 4
- 80 Phillips St
- 72 Phillips St
- 1054 Main St
- 170 Elm St
- 255 Holmes St
- 1754 Central St
- 26 Franklin St
- 126-130 Franklin St
- 9 Daisy Ln
- 1247 Central St
- 479 Main St
- Lot 2 Harvard Rd
- Lot 6 Way
- 1 Lamppost Dr
- 318 South St
- Plan B Northville Village Unit Plan B
- Unit 12 Northville Village Unit 12
- Unit 11 Northville Village Unit 11
- 57 Liberty St