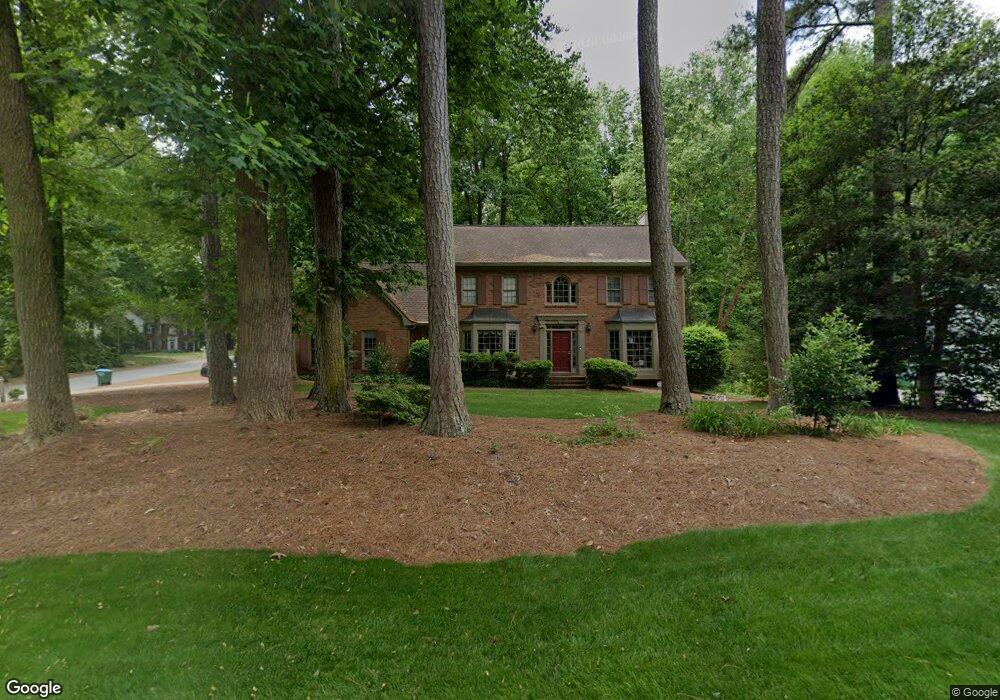
1357 Rivermist Dr SW Unit 10 Lilburn, GA 30047
Estimated Value: $437,317 - $528,000
4
Beds
3
Baths
2,841
Sq Ft
$170/Sq Ft
Est. Value
About This Home
This home is located at 1357 Rivermist Dr SW Unit 10, Lilburn, GA 30047 and is currently estimated at $483,329, approximately $170 per square foot. 1357 Rivermist Dr SW Unit 10 is a home located in Gwinnett County with nearby schools including Head Elementary School, Five Forks Middle School, and Brookwood High School.
Ownership History
Date
Name
Owned For
Owner Type
Purchase Details
Closed on
Jul 14, 2005
Sold by
Stanford Christopher J and Stanford Carla
Bought by
Sawyer Paul D and Sawyer Susan
Current Estimated Value
Purchase Details
Closed on
Nov 13, 2001
Sold by
Mcklveen William R and Mcklveen Laura A
Bought by
Stanford Christopher J and Stanford Carla B
Home Financials for this Owner
Home Financials are based on the most recent Mortgage that was taken out on this home.
Original Mortgage
$208,550
Interest Rate
4.25%
Mortgage Type
New Conventional
Purchase Details
Closed on
Feb 25, 1994
Sold by
Lambert Charles R Mary K
Bought by
Mckleveen William R Laura A
Home Financials for this Owner
Home Financials are based on the most recent Mortgage that was taken out on this home.
Original Mortgage
$156,250
Interest Rate
7.04%
Create a Home Valuation Report for This Property
The Home Valuation Report is an in-depth analysis detailing your home's value as well as a comparison with similar homes in the area
Home Values in the Area
Average Home Value in this Area
Purchase History
| Date | Buyer | Sale Price | Title Company |
|---|---|---|---|
| Sawyer Paul D | $261,000 | -- | |
| Stanford Christopher J | $219,600 | -- | |
| Mckleveen William R Laura A | $164,500 | -- |
Source: Public Records
Mortgage History
| Date | Status | Borrower | Loan Amount |
|---|---|---|---|
| Previous Owner | Stanford Christopher J | $208,550 | |
| Previous Owner | Mckleveen William R Laura A | $156,250 |
Source: Public Records
Tax History Compared to Growth
Tax History
| Year | Tax Paid | Tax Assessment Tax Assessment Total Assessment is a certain percentage of the fair market value that is determined by local assessors to be the total taxable value of land and additions on the property. | Land | Improvement |
|---|---|---|---|---|
| 2025 | $1,280 | $180,440 | $30,000 | $150,440 |
| 2024 | -- | $175,160 | $30,000 | $145,160 |
| 2023 | $1,119 | $162,440 | $35,600 | $126,840 |
| 2022 | $0 | $162,440 | $35,600 | $126,840 |
| 2021 | $3,042 | $122,400 | $23,200 | $99,200 |
| 2020 | $3,042 | $109,440 | $23,200 | $86,240 |
| 2019 | $3,042 | $104,880 | $20,000 | $84,880 |
| 2018 | $3,366 | $104,880 | $20,000 | $84,880 |
| 2016 | $3,015 | $87,720 | $17,600 | $70,120 |
| 2015 | $3,042 | $87,720 | $17,600 | $70,120 |
| 2014 | $3,056 | $87,720 | $17,600 | $70,120 |
Source: Public Records
Map
Nearby Homes
- 3846 Teresa Terrace SW
- 1315 Killian Shoals Way SW
- 978 Gwens Trail SW
- 1293 Elk Terrace SW
- 1314 Elk Terrace SW
- 3663 Stonelake Ct SW Unit 1
- 1011 Guys Ct SW
- 1394 Rustlewood Ct SW
- 1221 Martin Nash Rd SW
- 924 Hazel Ct SW
- 3321 Newburn St SW
- 1535 Pathfinder Way SW Unit 1
- 5299 Noble Village Way
- 5099 Noble Village Way
- 3331 Manchester Dr SW
- 3725 Hunting Ridge Dr SW
- 1043 Wash Lee Dr SW
- 3868 Buckland Dr SW
- 1347 Rivermist Dr SW
- 3721 Windhurst Dr SW
- 1367 Rivermist Dr SW
- 1337 Rivermist Dr SW
- 3710 Windhurst Dr SW
- 1348 Rivermist Dr SW
- 1358 Rivermist Dr SW Unit 10
- 1338 Rivermist Dr SW Unit 10
- 1368 Rivermist Dr SW
- 3751 Windhurst Dr SW
- 1327 Rivermist Dr SW
- 1377 Rivermist Dr SW
- 1308 Rivermist Dr SW
- 3730 Windhurst Dr SW
- 1410 Sandford Trail SW Unit 11
- 1378 Rivermist Dr SW
- 3761 Windhurst Dr SW
- 1387 Rivermist Dr SW
- 1248 Woodcliff Ct SW Unit 10
- 3951 Windhurst Dr SW