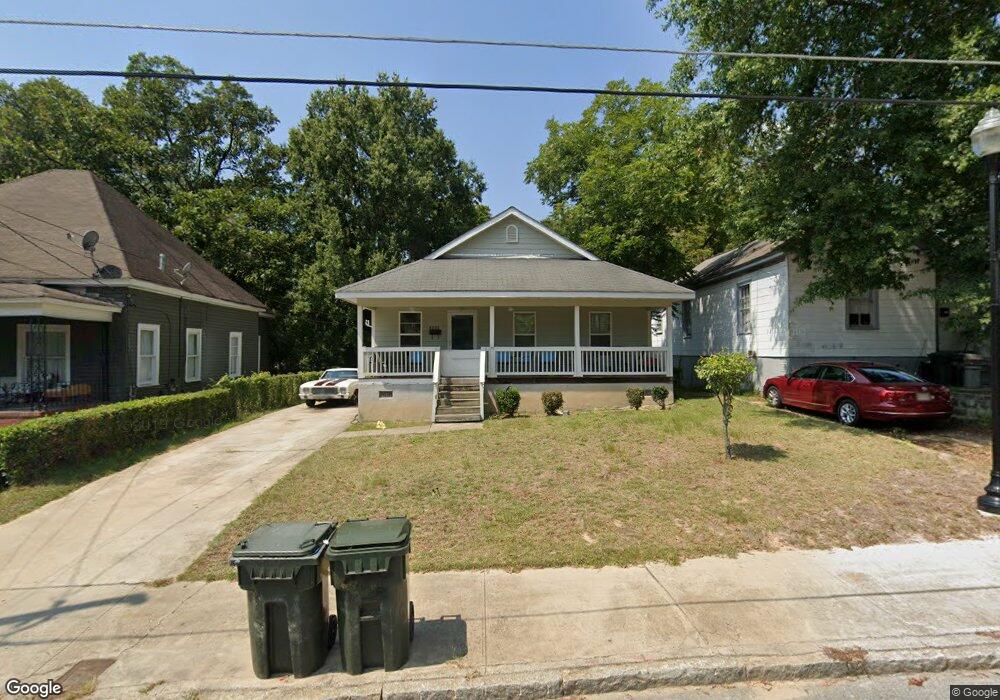
1357 Ross St Macon, GA 31201
Bealls Hill Historic District NeighborhoodEstimated Value: $142,000 - $192,000
3
Beds
1
Bath
1,116
Sq Ft
$147/Sq Ft
Est. Value
About This Home
This home is located at 1357 Ross St, Macon, GA 31201 and is currently estimated at $164,104, approximately $147 per square foot. 1357 Ross St is a home located in Bibb County with nearby schools including Ingram-Pye Elementary School, Southwest High School, and St. Joseph's Catholic School.
Ownership History
Date
Name
Owned For
Owner Type
Purchase Details
Closed on
Jan 14, 2005
Sold by
Macon Area Habitat For Humanity Inc
Bought by
Head Willie
Current Estimated Value
Home Financials for this Owner
Home Financials are based on the most recent Mortgage that was taken out on this home.
Original Mortgage
$46,000
Interest Rate
5.62%
Mortgage Type
New Conventional
Purchase Details
Closed on
Mar 22, 2004
Purchase Details
Closed on
Sep 9, 2003
Create a Home Valuation Report for This Property
The Home Valuation Report is an in-depth analysis detailing your home's value as well as a comparison with similar homes in the area
Home Values in the Area
Average Home Value in this Area
Purchase History
| Date | Buyer | Sale Price | Title Company |
|---|---|---|---|
| Head Willie | $66,000 | None Available | |
| -- | -- | -- | |
| -- | $2,200 | -- |
Source: Public Records
Mortgage History
| Date | Status | Borrower | Loan Amount |
|---|---|---|---|
| Closed | Head Willie | $46,000 |
Source: Public Records
Tax History Compared to Growth
Tax History
| Year | Tax Paid | Tax Assessment Tax Assessment Total Assessment is a certain percentage of the fair market value that is determined by local assessors to be the total taxable value of land and additions on the property. | Land | Improvement |
|---|---|---|---|---|
| 2025 | $1,127 | $52,873 | $6,600 | $46,273 |
| 2024 | $1,165 | $52,873 | $6,600 | $46,273 |
| 2023 | $497 | $44,561 | $6,000 | $38,561 |
| 2022 | $1,615 | $53,655 | $8,722 | $44,933 |
| 2021 | $1,288 | $40,897 | $6,709 | $34,188 |
| 2020 | $1,316 | $40,897 | $6,709 | $34,188 |
| 2019 | $1,327 | $40,897 | $6,709 | $34,188 |
| 2018 | $2,212 | $40,897 | $6,709 | $34,188 |
| 2017 | $1,209 | $39,269 | $6,709 | $32,560 |
| 2016 | $1,116 | $39,269 | $6,709 | $32,560 |
| 2015 | $1,581 | $39,269 | $6,709 | $32,560 |
| 2014 | $1,869 | $39,269 | $6,709 | $32,560 |
Source: Public Records
Map
Nearby Homes