1358 Cambridge Blvd Columbus, OH 43212
Estimated Value: $1,177,000 - $1,676,000
5
Beds
4
Baths
4,041
Sq Ft
$335/Sq Ft
Est. Value
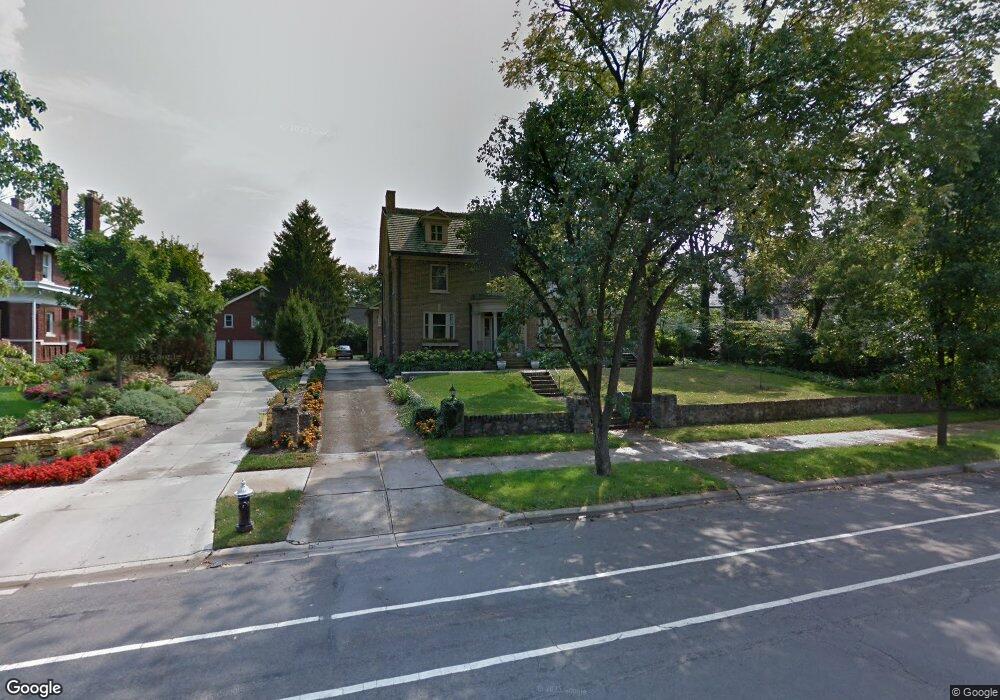
About This Home
This home is located at 1358 Cambridge Blvd, Columbus, OH 43212 and is currently estimated at $1,354,595, approximately $335 per square foot. 1358 Cambridge Blvd is a home located in Franklin County with nearby schools including Robert Louis Stevenson Elementary School, Larson Middle School, and Grandview Heights High School.
Ownership History
Date
Name
Owned For
Owner Type
Purchase Details
Closed on
Nov 28, 2012
Sold by
Cadden Timothy S and Cadden Joan
Bought by
Cadden Steven
Current Estimated Value
Home Financials for this Owner
Home Financials are based on the most recent Mortgage that was taken out on this home.
Original Mortgage
$144,833
Outstanding Balance
$100,298
Interest Rate
3.36%
Mortgage Type
FHA
Estimated Equity
$1,254,297
Purchase Details
Closed on
Aug 5, 2011
Sold by
Gray John A
Bought by
Jolson Matthew R and Jolson Kimberly A
Home Financials for this Owner
Home Financials are based on the most recent Mortgage that was taken out on this home.
Original Mortgage
$608,800
Outstanding Balance
$410,154
Interest Rate
4%
Mortgage Type
New Conventional
Estimated Equity
$944,441
Purchase Details
Closed on
Nov 22, 1988
Bought by
Gray John A
Create a Home Valuation Report for This Property
The Home Valuation Report is an in-depth analysis detailing your home's value as well as a comparison with similar homes in the area
Home Values in the Area
Average Home Value in this Area
Purchase History
| Date | Buyer | Sale Price | Title Company |
|---|---|---|---|
| Cadden Steven | -- | None Available | |
| Jolson Matthew R | -- | Attorney | |
| Gray John A | -- | -- |
Source: Public Records
Mortgage History
| Date | Status | Borrower | Loan Amount |
|---|---|---|---|
| Open | Cadden Steven | $144,833 | |
| Open | Jolson Matthew R | $608,800 |
Source: Public Records
Tax History Compared to Growth
Tax History
| Year | Tax Paid | Tax Assessment Tax Assessment Total Assessment is a certain percentage of the fair market value that is determined by local assessors to be the total taxable value of land and additions on the property. | Land | Improvement |
|---|---|---|---|---|
| 2024 | $21,263 | $429,380 | $138,600 | $290,780 |
| 2023 | $18,829 | $446,880 | $138,600 | $308,280 |
| 2022 | $16,801 | $334,640 | $64,860 | $269,780 |
| 2021 | $16,818 | $334,640 | $64,860 | $269,780 |
| 2020 | $16,738 | $334,640 | $64,860 | $269,780 |
| 2019 | $15,904 | $280,710 | $64,860 | $215,850 |
| 2018 | $15,482 | $280,710 | $64,860 | $215,850 |
| 2017 | $14,924 | $280,710 | $64,860 | $215,850 |
| 2016 | $15,136 | $248,330 | $59,920 | $188,410 |
| 2015 | $15,137 | $248,330 | $59,920 | $188,410 |
| 2014 | $15,331 | $248,330 | $59,920 | $188,410 |
| 2013 | $6,650 | $225,750 | $54,460 | $171,290 |
Source: Public Records
Map
Nearby Homes
- 1313 Lincoln Rd
- 1459 Elmwood Ave Unit 1459
- 1561 Glenn Ave
- 2015 W 5th Ave Unit 211
- 2015 W 5th Ave Unit 102
- 2015 W 5th Ave Unit 108
- 1631 Roxbury Rd Unit F3
- 1631 Roxbury Rd Unit B6
- 1263 Oakland Ave
- 1324 Lake Shore Dr Unit B
- 1301 Lake Shore Dr Unit 199
- 1000 Urlin Ave Unit 1822
- 1000 Urlin Ave Unit 2007
- 1000 Urlin Ave Unit 520
- 1000 Urlin Ave Unit 605
- 1000 Urlin Ave Unit 511
- 1000 Urlin Ave Unit 1007
- 1000 Urlin Ave Unit 518
- 1000 Urlin Ave Unit 1607
- 1655-1657 Ashland Ave
- 1370 Cambridge Blvd
- 0 Lincoln Rd
- 1355 Lincoln Rd
- 1382 Cambridge Blvd
- 1361 Lincoln Rd
- 1371 Lincoln Rd
- 1329 Lincoln Rd
- 1339 Lincoln Rd
- 1317 Lincoln Rd
- 1363 Cambridge Blvd
- 1345 Cambridge Blvd
- 1400 Cambridge Blvd
- 1373 Cambridge Blvd
- 1383 Lincoln Rd
- 1335 Cambridge Blvd
- 1389 Cambridge Blvd
- 1393 Lincoln Rd
- 1358 Lincoln Rd
- 1342 Lincoln Rd
- 1325 Cambridge Blvd