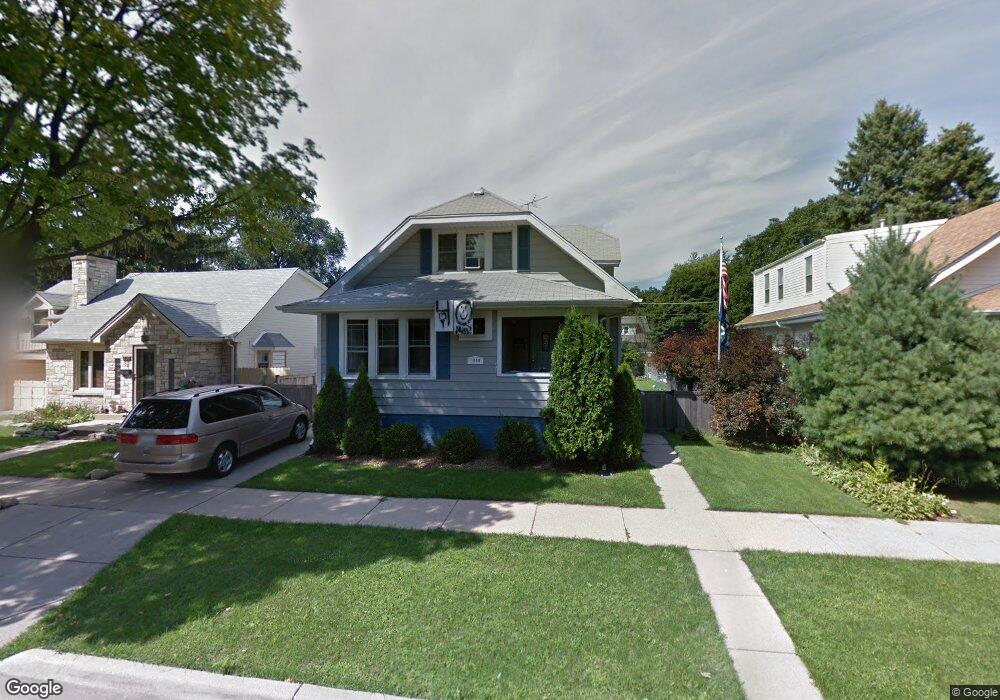
1358 Campbell Ave Des Plaines, IL 60016
Estimated Value: $352,000 - $630,000
4
Beds
2
Baths
1,142
Sq Ft
$388/Sq Ft
Est. Value
About This Home
This home is located at 1358 Campbell Ave, Des Plaines, IL 60016 and is currently estimated at $443,186, approximately $388 per square foot. 1358 Campbell Ave is a home located in Cook County with nearby schools including Central Elementary School, Chippewa Middle School, and Maine West High School.
Ownership History
Date
Name
Owned For
Owner Type
Purchase Details
Closed on
Dec 15, 2016
Sold by
Conor Timothy J O and Conor Melissa M O
Bought by
Conor Timothy J O and Conor Melissa M O
Current Estimated Value
Purchase Details
Closed on
Dec 27, 2006
Sold by
Bernhoft Corrie L
Bought by
Oconor Timothy J and Oconor Melissa M
Home Financials for this Owner
Home Financials are based on the most recent Mortgage that was taken out on this home.
Original Mortgage
$250,000
Outstanding Balance
$146,337
Interest Rate
6.21%
Mortgage Type
Purchase Money Mortgage
Estimated Equity
$296,849
Purchase Details
Closed on
Apr 6, 2005
Sold by
Albrecht Gladys M
Bought by
Bernhoft Corrie L
Home Financials for this Owner
Home Financials are based on the most recent Mortgage that was taken out on this home.
Original Mortgage
$222,250
Interest Rate
6.75%
Mortgage Type
Unknown
Create a Home Valuation Report for This Property
The Home Valuation Report is an in-depth analysis detailing your home's value as well as a comparison with similar homes in the area
Home Values in the Area
Average Home Value in this Area
Purchase History
| Date | Buyer | Sale Price | Title Company |
|---|---|---|---|
| Conor Timothy J O | -- | None Available | |
| Oconor Timothy J | $450,000 | Pntn | |
| Bernhoft Corrie L | $317,500 | Pntn |
Source: Public Records
Mortgage History
| Date | Status | Borrower | Loan Amount |
|---|---|---|---|
| Open | Oconor Timothy J | $250,000 | |
| Previous Owner | Bernhoft Corrie L | $222,250 | |
| Closed | Bernhoft Corrie L | $63,500 |
Source: Public Records
Tax History
| Year | Tax Paid | Tax Assessment Tax Assessment Total Assessment is a certain percentage of the fair market value that is determined by local assessors to be the total taxable value of land and additions on the property. | Land | Improvement |
|---|---|---|---|---|
| 2025 | $6,508 | $35,000 | $5,625 | $29,375 |
| 2024 | $6,508 | $28,000 | $5,000 | $23,000 |
| 2023 | $6,325 | $28,000 | $5,000 | $23,000 |
| 2022 | $6,325 | $28,000 | $5,000 | $23,000 |
| 2021 | $5,310 | $20,605 | $4,062 | $16,543 |
| 2020 | $5,289 | $20,605 | $4,062 | $16,543 |
| 2019 | $5,239 | $22,895 | $4,062 | $18,833 |
| 2018 | $4,945 | $19,971 | $3,593 | $16,378 |
| 2017 | $4,876 | $19,971 | $3,593 | $16,378 |
| 2016 | $4,856 | $19,971 | $3,593 | $16,378 |
| 2015 | $4,784 | $18,448 | $3,125 | $15,323 |
| 2014 | $4,699 | $18,448 | $3,125 | $15,323 |
| 2013 | $4,565 | $18,448 | $3,125 | $15,323 |
Source: Public Records
Map
Nearby Homes
- 1380 Oakwood Ave Unit 306
- 905 Center St Unit B208
- 900 Center St Unit 3A
- 1524 Oakwood Ave
- 1277 E Thacker St Unit 303
- 1630 Henry Ave
- 1048 E Walnut Ave
- 1638 Oakwood Ave
- 787 Graceland Ave Unit 202B
- 821 Lexington Cir E
- 1649 Ashland Ave Unit 501
- 1600 E Thacker St Unit 513
- 1700 E Forest Ave
- 770 Pearson St Unit 808
- 750 Pearson St Unit 904
- 1080 Bogart St
- 1107 E Prairie Ave
- 711 S River Rd Unit 617
- 711 S River Rd Unit 704
- 650 S River Rd Unit 812
- 1366 Campbell Ave
- 1350 Campbell Ave
- 1374 Campbell Ave
- 1342 Campbell Ave
- 1361 Henry Ave
- 1353 Henry Ave
- 1384 Campbell Ave
- 1334 Campbell Ave
- 1345 Henry Ave
- 1369 Henry Ave
- 1359 Campbell Ave
- 1337 Henry Ave
- 1337 Henry Ave Unit CH
- 1379 Henry Ave
- 1367 Campbell Ave
- 1351 Campbell Ave
- 1394 Campbell Ave
- 1326 Campbell Ave
- 1375 Campbell Ave
- 1343 Campbell Ave
Your Personal Tour Guide
Ask me questions while you tour the home.