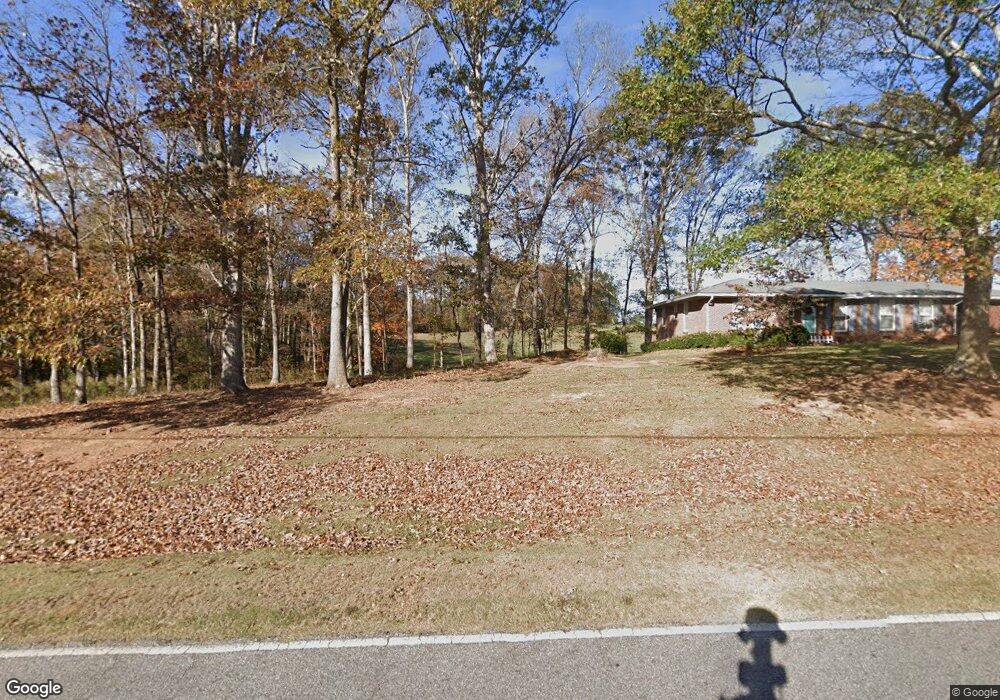
1358 Loyd Nelms Rd Nicholson, GA 30565
Estimated Value: $294,448 - $388,000
3
Beds
2
Baths
1,569
Sq Ft
$219/Sq Ft
Est. Value
About This Home
This home is located at 1358 Loyd Nelms Rd, Nicholson, GA 30565 and is currently estimated at $342,862, approximately $218 per square foot. 1358 Loyd Nelms Rd is a home located in Madison County with nearby schools including Madison County High School.
Ownership History
Date
Name
Owned For
Owner Type
Purchase Details
Closed on
Jun 28, 2016
Sold by
Stone A L and Stone Mary Matthews
Bought by
Bishop Charles and Bishop Gloria
Current Estimated Value
Home Financials for this Owner
Home Financials are based on the most recent Mortgage that was taken out on this home.
Original Mortgage
$151,737
Outstanding Balance
$121,443
Interest Rate
3.66%
Mortgage Type
VA
Estimated Equity
$221,419
Purchase Details
Closed on
Feb 4, 2016
Sold by
L Mary Matthews Stone Fa A
Bought by
Tate Jennifer Marie and Tate Michael Paul
Purchase Details
Closed on
Sep 18, 2015
Sold by
L Mary Matthews Stone F A
Bought by
Shepherd Avanelle
Purchase Details
Closed on
Sep 29, 2012
Sold by
Stone Mary F
Bought by
A L & Mary Matthews Stone Family Lp
Purchase Details
Closed on
Feb 5, 2005
Sold by
Stone A L
Bought by
A L Mary Matthews Stone Lp
Purchase Details
Closed on
Jan 1, 1942
Sold by
Stone A L & Mary Matthews Lp
Bought by
Stone A L
Create a Home Valuation Report for This Property
The Home Valuation Report is an in-depth analysis detailing your home's value as well as a comparison with similar homes in the area
Home Values in the Area
Average Home Value in this Area
Purchase History
| Date | Buyer | Sale Price | Title Company |
|---|---|---|---|
| Bishop Charles | $146,890 | -- | |
| Tate Jennifer Marie | $42,500 | -- | |
| Shepherd Avanelle | $87,845 | -- | |
| A L & Mary Matthews Stone Family Lp | -- | -- | |
| A L Mary Matthews Stone Lp | -- | -- | |
| Stone A L | -- | -- |
Source: Public Records
Mortgage History
| Date | Status | Borrower | Loan Amount |
|---|---|---|---|
| Open | Bishop Charles | $151,737 |
Source: Public Records
Tax History Compared to Growth
Tax History
| Year | Tax Paid | Tax Assessment Tax Assessment Total Assessment is a certain percentage of the fair market value that is determined by local assessors to be the total taxable value of land and additions on the property. | Land | Improvement |
|---|---|---|---|---|
| 2024 | $1,944 | $92,703 | $14,246 | $78,457 |
| 2023 | $2,597 | $85,070 | $11,872 | $73,198 |
| 2022 | $1,504 | $72,513 | $8,162 | $64,351 |
| 2021 | $1,187 | $56,880 | $8,162 | $48,718 |
| 2020 | $1,405 | $55,693 | $6,975 | $48,718 |
| 2019 | $1,387 | $54,601 | $6,975 | $47,626 |
| 2018 | $1,636 | $52,449 | $6,381 | $46,068 |
| 2017 | $1,244 | $43,197 | $5,936 | $37,261 |
| 2016 | $814 | $46,021 | $24,616 | $21,405 |
| 2015 | $624 | $62,917 | $41,512 | $21,405 |
| 2014 | $621 | $62,936 | $41,512 | $21,423 |
| 2013 | -- | $62,936 | $41,512 | $21,423 |
Source: Public Records
Map
Nearby Homes
- 1771 Leon Ellis Rd
- 2345 Seagraves Mill Rd
- 310 Sawdust Rd
- 1718 Ed Bennett Rd
- 10 Red Rose Rd
- 322 Cedar Tree Ln
- 130 Levi Trail
- 140 Levi Trail
- 0 Nowhere Ln Unit 10544151
- 7 Red Rose Rd
- 9 Red Rose Rd
- 719 Old Athens Dr
- 520 Old Athens Dr
- 260 Oak Cir
- 166 Oak Cir
- 97 Abby Ln
- 0 US Hwy 441 S Unit 20890220
- 8541 Georgia 334
- 24 Quail Ridge Dr
- 1246 Stone Stewart Rd
- 1322 Loyd Nelms Rd
- 1206 Loyd Nelms Rd
- 1640 Loyd Nelms Rd
- 1358 Lloyd Nelms Rd
- 1151 Loyd Nelms Rd
- 1291 Loyd Nelms Rd
- 1235 Lloyd Nelms Rd
- 966 Loyd Nelms Rd
- 1574 Loyd Nelms Rd
- 1073 Loyd Nelms Rd
- 1291 Lloyd Nelms Rd
- 1235 Loyd Nelms Rd
- 0 Loyd Nelms Rd
- 0 Loyd Nelms Rd Unit 8334463
- 0 Loyd Nelms Rd Unit 7230079
- 0 Loyd Nelms Rd Unit 7190560
- 0 Loyd Nelms Rd Unit 7221437
- 0 Thunderwood Ct Unit 8147329
- 132 Thunderwood Ct
- 1057 Loyd Nelms Rd