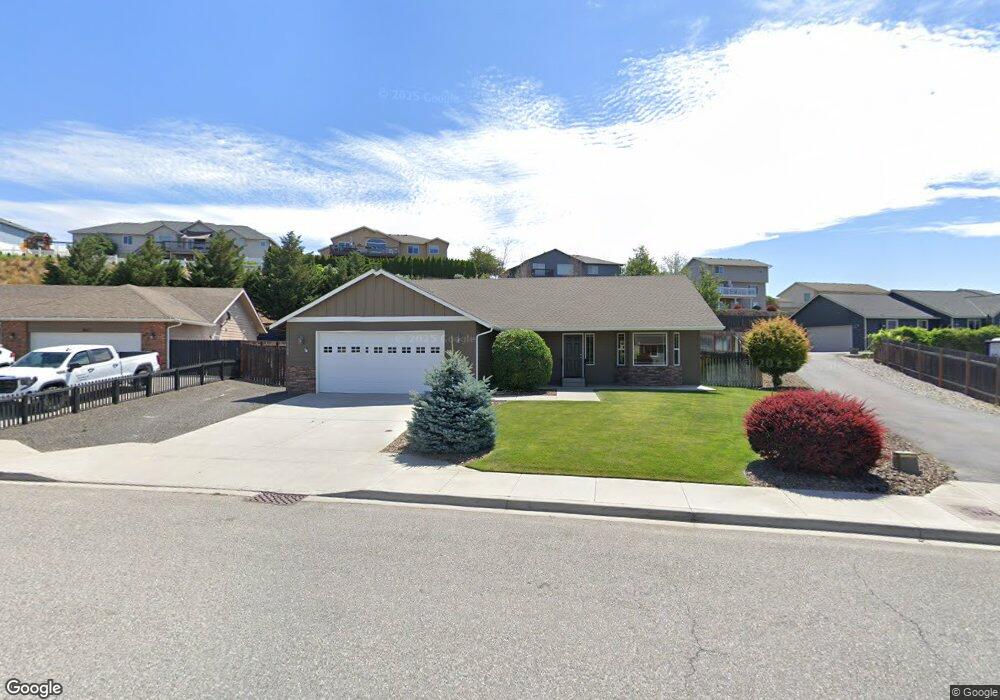
1358 Tractor Loop East Wenatchee, WA 98802
Estimated Value: $432,000 - $533,000
3
Beds
2
Baths
1,522
Sq Ft
$323/Sq Ft
Est. Value
About This Home
This home is located at 1358 Tractor Loop, East Wenatchee, WA 98802 and is currently estimated at $492,065, approximately $323 per square foot. 1358 Tractor Loop is a home located in Douglas County with nearby schools including Cascade Elementary School, Sterling Intermediate School, and Eastmont Junior High School.
Ownership History
Date
Name
Owned For
Owner Type
Purchase Details
Closed on
Aug 30, 2017
Sold by
Jordan Wade Alex and Jordan Brittany Noel
Bought by
Gordon Michael and Gordon Linda
Current Estimated Value
Purchase Details
Closed on
Aug 27, 2015
Sold by
Maroney Bryan J and Maroney Christine A
Bought by
Jordan Wade Alex and Jordan Brittany Noel
Home Financials for this Owner
Home Financials are based on the most recent Mortgage that was taken out on this home.
Original Mortgage
$245,373
Interest Rate
3.62%
Mortgage Type
FHA
Purchase Details
Closed on
Feb 24, 2009
Sold by
Sparling Steve and Sparling Anne Marie
Bought by
Maroney Bryan J and Maroney Christine A
Home Financials for this Owner
Home Financials are based on the most recent Mortgage that was taken out on this home.
Original Mortgage
$218,960
Interest Rate
4.91%
Mortgage Type
FHA
Purchase Details
Closed on
Dec 18, 2005
Sold by
Prime Properties Llc
Bought by
Sparling Steve and Sparling Anne Marie
Create a Home Valuation Report for This Property
The Home Valuation Report is an in-depth analysis detailing your home's value as well as a comparison with similar homes in the area
Home Values in the Area
Average Home Value in this Area
Purchase History
| Date | Buyer | Sale Price | Title Company |
|---|---|---|---|
| Gordon Michael | $295,000 | First American Title Ins Co | |
| Jordan Wade Alex | $249,900 | First American Title Ins Co | |
| Maroney Bryan J | $223,000 | Pioneer Title Co | |
| Sparling Steve | $33,326 | None Available |
Source: Public Records
Mortgage History
| Date | Status | Borrower | Loan Amount |
|---|---|---|---|
| Previous Owner | Jordan Wade Alex | $245,373 | |
| Previous Owner | Maroney Bryan J | $218,960 |
Source: Public Records
Tax History Compared to Growth
Tax History
| Year | Tax Paid | Tax Assessment Tax Assessment Total Assessment is a certain percentage of the fair market value that is determined by local assessors to be the total taxable value of land and additions on the property. | Land | Improvement |
|---|---|---|---|---|
| 2025 | $90 | $406,700 | $125,000 | $281,700 |
| 2024 | $3,282 | $384,800 | $100,000 | $284,800 |
| 2023 | $3,730 | $375,000 | $100,000 | $275,000 |
| 2022 | $3,386 | $315,700 | $80,000 | $235,700 |
| 2021 | $3,707 | $315,700 | $80,000 | $235,700 |
| 2020 | $3,494 | $318,000 | $80,000 | $238,000 |
| 2018 | $3,166 | $268,600 | $60,500 | $208,100 |
| 2017 | $2,701 | $268,600 | $60,500 | $208,100 |
| 2016 | $2,463 | $246,500 | $55,000 | $191,500 |
| 2015 | $2,216 | $216,600 | $55,000 | $161,600 |
| 2014 | -- | $186,900 | $55,000 | $131,900 |
| 2013 | -- | $184,300 | $55,000 | $129,300 |
Source: Public Records
Map
Nearby Homes
- 1348 Wheatridge Dr
- 1364 Duram Dr
- 2429 Highlandview Dr
- 2523 Plateau Dr
- 902 NE Tyler Place
- 760 NE Tyler Place
- 705 NE Tyler Place
- 2327 Grand Ave
- 710 NE Tyler Place
- 2323 Fancher Heights Blvd
- 606 Ski View Dr
- 0 Mountain View Dr
- 326 23rd St NE
- 1992 Stoneridge Dr
- 2714 Casa Mia Dr
- 209 27th St NE
- 946 Briarwood Dr
- 1653 Holly Ln
- 351 19th St NE Unit 26
- 351 19th St NE Unit 21
- 1354 Tractor Loop
- 1364 Tractor Loop
- 1360 Tractor Loop
- 2440 Harvester Loop
- 2432 Harvester Loop
- 1348 Tractor Loop
- 1359 Tractor Loop
- 2448 Harvester Loop
- 2424 Harvester Loop
- 1365 Tractor Loop
- 2445 Canyon Hills Dr
- 2429 Canyon Hills Dr
- 1346 Tractor Loop
- 1351 Tractor Loop
- 2456 Harvester Loop
- 1371 Tractor Loop
- 2435 Canyon Hills Dr
- 2416 Harvester Loop
- 1321 Tractor Loop
- 1315 Tractor Loop