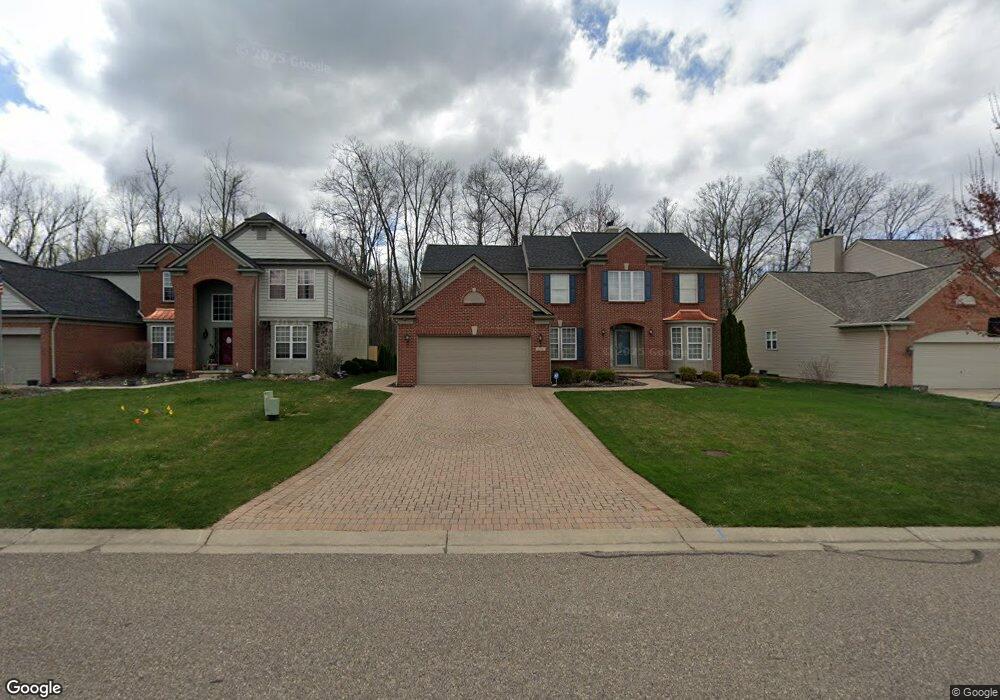
1359 Callaway Ct Unit 13 Howell, MI 48843
Estimated Value: $399,000 - $552,000
4
Beds
3
Baths
3,041
Sq Ft
$160/Sq Ft
Est. Value
About This Home
This home is located at 1359 Callaway Ct Unit 13, Howell, MI 48843 and is currently estimated at $486,406, approximately $159 per square foot. 1359 Callaway Ct Unit 13 is a home located in Livingston County with nearby schools including Ruahmah J. Hutchings Elementary, Parker Middle School, and Howell High School.
Ownership History
Date
Name
Owned For
Owner Type
Purchase Details
Closed on
Sep 15, 2021
Sold by
Kovacs Eugene G
Bought by
Kovacs Eugene G and Kovacs Elizabeth L
Current Estimated Value
Purchase Details
Closed on
Aug 24, 2012
Sold by
Kovacs Eugene G
Bought by
Kovacs Eugene G
Purchase Details
Closed on
Jul 8, 2011
Sold by
Kovacs Eugene G and Kovacs Leeanna D
Bought by
Kovacs Eugene G and Kovacs Leeanna D
Home Financials for this Owner
Home Financials are based on the most recent Mortgage that was taken out on this home.
Original Mortgage
$152,933
Interest Rate
4.52%
Mortgage Type
Unknown
Purchase Details
Closed on
Aug 25, 2004
Sold by
Pulte Land Co Llc
Bought by
The Kovacs Family Trust
Create a Home Valuation Report for This Property
The Home Valuation Report is an in-depth analysis detailing your home's value as well as a comparison with similar homes in the area
Home Values in the Area
Average Home Value in this Area
Purchase History
| Date | Buyer | Sale Price | Title Company |
|---|---|---|---|
| Kovacs Eugene G | -- | None Available | |
| Kovacs Eugene G | -- | -- | |
| Kovacs Eugene G | -- | -- | |
| The Kovacs Family Trust | $95,000 | Metropolitan Title Company |
Source: Public Records
Mortgage History
| Date | Status | Borrower | Loan Amount |
|---|---|---|---|
| Previous Owner | Kovacs Eugene G | $152,933 |
Source: Public Records
Tax History Compared to Growth
Tax History
| Year | Tax Paid | Tax Assessment Tax Assessment Total Assessment is a certain percentage of the fair market value that is determined by local assessors to be the total taxable value of land and additions on the property. | Land | Improvement |
|---|---|---|---|---|
| 2025 | $2,685 | $275,400 | $0 | $0 |
| 2024 | $2,608 | $252,600 | $0 | $0 |
| 2023 | $2,491 | $226,000 | $0 | $0 |
| 2022 | $1,146 | $192,200 | $0 | $0 |
| 2021 | $6,528 | $197,400 | $0 | $0 |
| 2020 | $6,513 | $192,200 | $0 | $0 |
| 2019 | $6,430 | $178,800 | $0 | $0 |
| 2018 | $6,342 | $173,200 | $0 | $0 |
| 2017 | $6,261 | $170,400 | $0 | $0 |
| 2016 | $6,237 | $160,800 | $0 | $0 |
| 2014 | $4,136 | $142,900 | $0 | $0 |
| 2012 | $4,136 | $129,800 | $0 | $0 |
Source: Public Records
Map
Nearby Homes
- 3991 Rainier Dr Unit 1
- 636 Zion Ct
- 4059 Ash Tree Ln
- 1815 Gulley Rd
- 32 N Latson Rd
- 571 Cannonade Loop
- 523 Cannonade Loop
- 583 Cannonade Loop
- The Austin Plan at Broadmoor
- The Charlotte Plan at Broadmoor
- The Harrison Plan at Broadmoor
- The Bloomington Plan at Broadmoor
- The Columbia Plan at Broadmoor
- 475 Cannonade Loop
- 559 Cannonade Loop
- 3227 Waverly Woods Ln
- 3224 Waverly Woods Ln
- 3040 Bogues View Dr
- 3020 Brookline
- 1633 Frech Ln
- 1353 Callaway Ct Unit 14
- 1365 Callaway Ct Unit 12
- 1371 Callaway Ct Unit 11
- 1347 Callaway Ct Unit 15
- 4077 Landon Ct Unit 154
- 4076 Landon Ct Unit 149
- 1377 Callaway Ct Unit 10
- 1341 Callaway Ct Unit 16
- 1340 Callaway Ct Unit 148
- 4084 Landon Ct Unit 150
- 4085 Landon Ct Unit 153
- 1335 Callaway Ct Unit 17
- 1383 Callaway Ct Unit 9
- 4078 Sonata Dr Unit 155
- 4092 Landon Ct Unit Bldg-Unit
- 4092 Landon Ct Unit 151
- 4093 Landon Ct
- 4058 Hidden Trail Unit 7
- 4086 Sonata Dr Unit 156
- 1326 Callaway Ct Unit 147