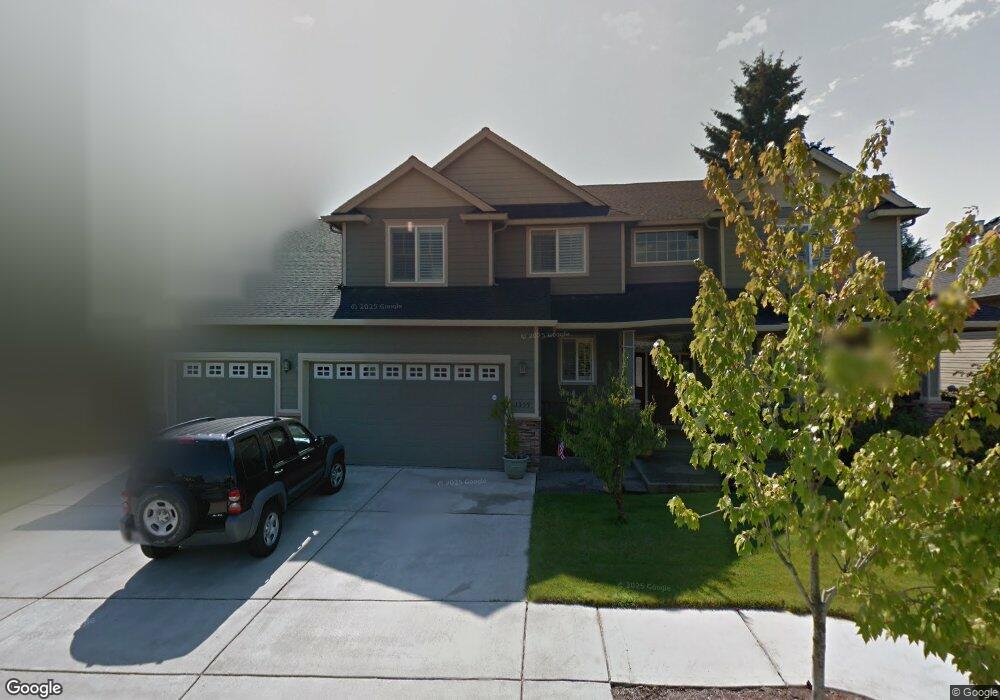
1359 S 8th Way Ridgefield, WA 98642
Estimated Value: $832,000 - $927,000
5
Beds
4
Baths
3,368
Sq Ft
$261/Sq Ft
Est. Value
About This Home
This home is located at 1359 S 8th Way, Ridgefield, WA 98642 and is currently estimated at $878,798, approximately $260 per square foot. 1359 S 8th Way is a home located in Clark County with nearby schools including Ridgefield High School.
Ownership History
Date
Name
Owned For
Owner Type
Purchase Details
Closed on
Jul 28, 2016
Sold by
Montgomery Kerry L and Montgomery Ryan N
Bought by
Hollister Chad A and Hollister Kellie J
Current Estimated Value
Home Financials for this Owner
Home Financials are based on the most recent Mortgage that was taken out on this home.
Original Mortgage
$483,521
Outstanding Balance
$386,539
Interest Rate
3.54%
Mortgage Type
VA
Estimated Equity
$492,259
Purchase Details
Closed on
Mar 22, 2006
Sold by
Brighten Homes Inc
Bought by
Montgomery Kerry L and Montgomery Ryan N
Purchase Details
Closed on
Jun 2, 2005
Sold by
Nvr Llc
Bought by
Brighten Homes Inc
Home Financials for this Owner
Home Financials are based on the most recent Mortgage that was taken out on this home.
Original Mortgage
$300,000
Interest Rate
5.74%
Mortgage Type
Purchase Money Mortgage
Create a Home Valuation Report for This Property
The Home Valuation Report is an in-depth analysis detailing your home's value as well as a comparison with similar homes in the area
Home Values in the Area
Average Home Value in this Area
Purchase History
| Date | Buyer | Sale Price | Title Company |
|---|---|---|---|
| Hollister Chad A | $485,100 | First Amer Title Vancouver | |
| Montgomery Kerry L | $550,000 | First American Title | |
| Brighten Homes Inc | $125,000 | Fidelity National Title |
Source: Public Records
Mortgage History
| Date | Status | Borrower | Loan Amount |
|---|---|---|---|
| Open | Hollister Chad A | $483,521 | |
| Previous Owner | Brighten Homes Inc | $300,000 |
Source: Public Records
Tax History Compared to Growth
Tax History
| Year | Tax Paid | Tax Assessment Tax Assessment Total Assessment is a certain percentage of the fair market value that is determined by local assessors to be the total taxable value of land and additions on the property. | Land | Improvement |
|---|---|---|---|---|
| 2025 | $7,155 | $823,513 | $155,000 | $668,513 |
| 2024 | $6,800 | $808,037 | $155,000 | $653,037 |
| 2023 | $6,495 | $818,431 | $155,000 | $663,431 |
| 2022 | $5,506 | $748,095 | $140,454 | $607,641 |
| 2021 | $5,721 | $593,146 | $114,750 | $478,396 |
| 2020 | $5,569 | $576,436 | $119,700 | $456,736 |
| 2019 | $5,560 | $553,426 | $108,585 | $444,841 |
| 2018 | $5,623 | $558,272 | $0 | $0 |
| 2017 | $4,677 | $487,495 | $0 | $0 |
| 2016 | $4,478 | $478,959 | $0 | $0 |
| 2015 | $4,322 | $439,565 | $0 | $0 |
| 2014 | -- | $406,006 | $0 | $0 |
| 2013 | -- | $374,448 | $0 | $0 |
Source: Public Records
Map
Nearby Homes
- 1114 S 6th Way
- 701 26th Place
- 911 S 6th Way
- 470 S 9th Ct
- 510 S 19th Place
- 28 S Gee Creek Loop
- 1910 S 15th Cir
- 745 S 21st Place
- 1276 S 15th Way
- 1925 S Osprey Dr
- 1410 S 21st Place
- 1761 S 18th Cir
- 1810 S Dusky Dr
- 717 S 26th Place
- 709 S 26th Place
- 701 S 26th Place
- 625 S 26th Place
- 8728 S 4th Way
- 8720 S 4th Way
- 2502 S 6th Way
- 1417 S 8th Way
- 1325 S 8th Way
- 844 S Hillhurst Rd
- 1356 S 8th Way
- 1356 S 8th Way Unit 57
- 786 S 14th Place
- 870 S Hillhurst Rd
- 1326 S 8th Way
- 1437 S 8th Way Unit 58
- 1437 S 8th Way
- 748 S 14th Place
- 1443 S 8th Way
- 888 S Hillhurst Rd
- 1308 S 8th Way
- 1446 S 8th Way
- 1353 S 7th Cir
- 1327 S 7th Cir
- 1447 S 8th Way
- 1447 S 8th Way Unit 59
- 0 S 15th Ct