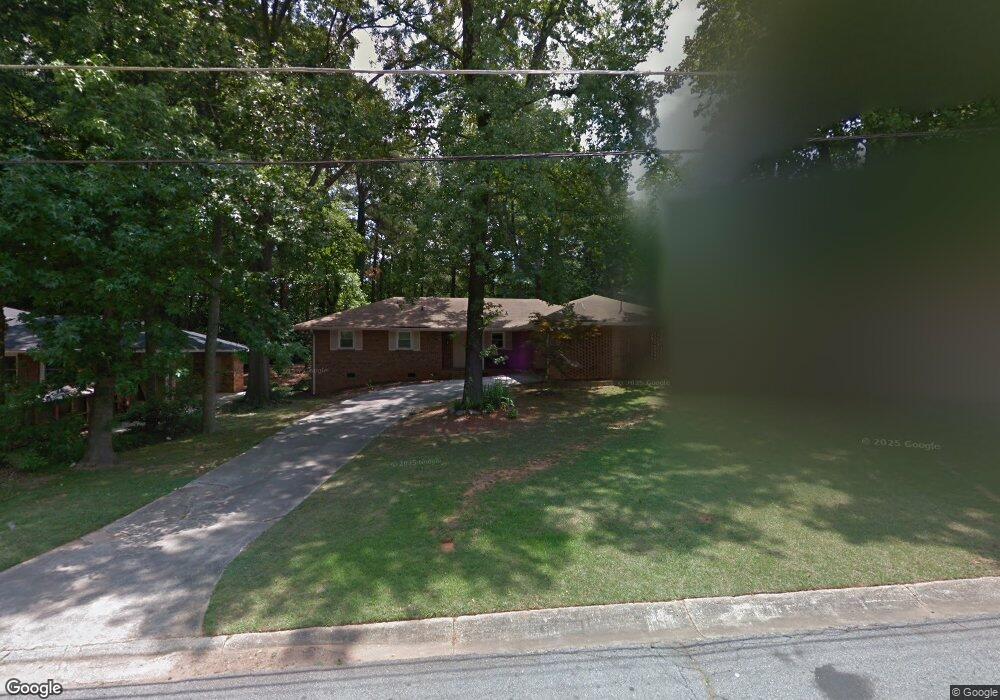
1359 Sanden Ferry Dr Unit 32 Decatur, GA 30033
Lindmoor Woods-Valley Brook Estates NeighborhoodEstimated Value: $430,000 - $486,000
3
Beds
2
Baths
1,527
Sq Ft
$299/Sq Ft
Est. Value
About This Home
This home is located at 1359 Sanden Ferry Dr Unit 32, Decatur, GA 30033 and is currently estimated at $456,071, approximately $298 per square foot. 1359 Sanden Ferry Dr Unit 32 is a home located in DeKalb County with nearby schools including Laurel Ridge Elementary School, Druid Hills Middle School, and Druid Hills High School.
Ownership History
Date
Name
Owned For
Owner Type
Purchase Details
Closed on
Jun 20, 2018
Sold by
Piszczek Craig
Bought by
Piszczek Craig and Bowman Ashley Marie
Current Estimated Value
Home Financials for this Owner
Home Financials are based on the most recent Mortgage that was taken out on this home.
Original Mortgage
$281,700
Outstanding Balance
$244,169
Interest Rate
4.6%
Mortgage Type
New Conventional
Estimated Equity
$211,902
Purchase Details
Closed on
Apr 4, 2016
Sold by
Sanders Peter C
Bought by
Rubino Ronnie and Rubino Susan
Purchase Details
Closed on
Jul 20, 2007
Sold by
Musser Jonathon R and Musser Jennifer C
Bought by
Sanders Peter C
Purchase Details
Closed on
Apr 26, 2002
Sold by
Williams Mckinney Janice E
Bought by
Musser Jonathon R
Purchase Details
Closed on
Aug 28, 2000
Sold by
O'Hern Bertadine
Bought by
Mckinney Janice E W
Create a Home Valuation Report for This Property
The Home Valuation Report is an in-depth analysis detailing your home's value as well as a comparison with similar homes in the area
Home Values in the Area
Average Home Value in this Area
Purchase History
| Date | Buyer | Sale Price | Title Company |
|---|---|---|---|
| Piszczek Craig | $313,000 | -- | |
| Piszczek Craig | $313,000 | -- | |
| Piszczek Craig | $313,000 | -- | |
| Piszczek Craig | $313,000 | -- | |
| Rubino Ronnie | $192,500 | -- | |
| Rubino Ronnie | $192,500 | -- | |
| Sanders Peter C | $224,800 | -- | |
| Sanders Peter C | $224,800 | -- | |
| Musser Jonathon R | $168,000 | -- | |
| Musser Jonathon R | $168,000 | -- | |
| Mckinney Janice E W | -- | -- | |
| Mckinney Janice E W | -- | -- |
Source: Public Records
Mortgage History
| Date | Status | Borrower | Loan Amount |
|---|---|---|---|
| Open | Piszczek Craig | $281,700 | |
| Closed | Piszczek Craig | $281,700 |
Source: Public Records
Tax History Compared to Growth
Tax History
| Year | Tax Paid | Tax Assessment Tax Assessment Total Assessment is a certain percentage of the fair market value that is determined by local assessors to be the total taxable value of land and additions on the property. | Land | Improvement |
|---|---|---|---|---|
| 2025 | $5,602 | $192,640 | $34,880 | $157,760 |
| 2024 | $4,901 | $153,640 | $34,280 | $119,360 |
| 2023 | $4,901 | $153,640 | $34,280 | $119,360 |
| 2022 | $4,578 | $165,400 | $34,280 | $131,120 |
| 2021 | $4,605 | $141,720 | $34,200 | $107,520 |
| 2020 | $3,929 | $115,480 | $34,200 | $81,280 |
| 2019 | $4,110 | $122,120 | $34,200 | $87,920 |
| 2018 | $4,085 | $85,320 | $34,200 | $51,120 |
| 2017 | $3,739 | $76,976 | $16,416 | $60,560 |
| 2016 | $4,002 | $82,760 | $17,160 | $65,600 |
| 2014 | $3,968 | $80,000 | $17,160 | $62,840 |
Source: Public Records
Map
Nearby Homes
- 1523 Delia Dr
- 1564 Delia Dr
- 1280 Sanden Ferry Dr
- 1498 Sanden Ferry Dr
- 1231 Sanden Ferry Dr
- 3214 Valaire Dr Unit 2
- 1445 Linkwood Ln
- 1402 Mclendon Dr
- 1245 Mclendon Dr
- 3453 Woodlawn Cir
- 1517 Vancouver Dr
- 3533 Johns Rd
- 3086 Frazier Walk
- 3107 Turman Cir
- 3068 Anthony Dr
- 3245 Oakbrook Ln
- 3119 Windfield Cir
- 1359 Sanden Ferry Dr
- 1351 Sanden Ferry Dr
- 1373 Sanden Ferry Dr
- 0 Sanden Ferry Dr Unit 8702775
- 0 Sanden Ferry Dr Unit 8617318
- 0 Sanden Ferry Dr Unit 8562864
- 0 Sanden Ferry Dr Unit 8562374
- 0 Sanden Ferry Dr Unit 8467613
- 0 Sanden Ferry Dr Unit 8448068
- 0 Sanden Ferry Dr Unit 8433854
- 0 Sanden Ferry Dr Unit 8362099
- 0 Sanden Ferry Dr Unit 8274241
- 0 Sanden Ferry Dr Unit 8202115
- 0 Sanden Ferry Dr Unit 8079403
- 0 Sanden Ferry Dr Unit 8063545
- 0 Sanden Ferry Dr Unit 8002371
- 0 Sanden Ferry Dr Unit 7605258
- 0 Sanden Ferry Dr Unit 8403188
- 0 Sanden Ferry Dr Unit 8781270
- 0 Sanden Ferry Dr Unit 7116603