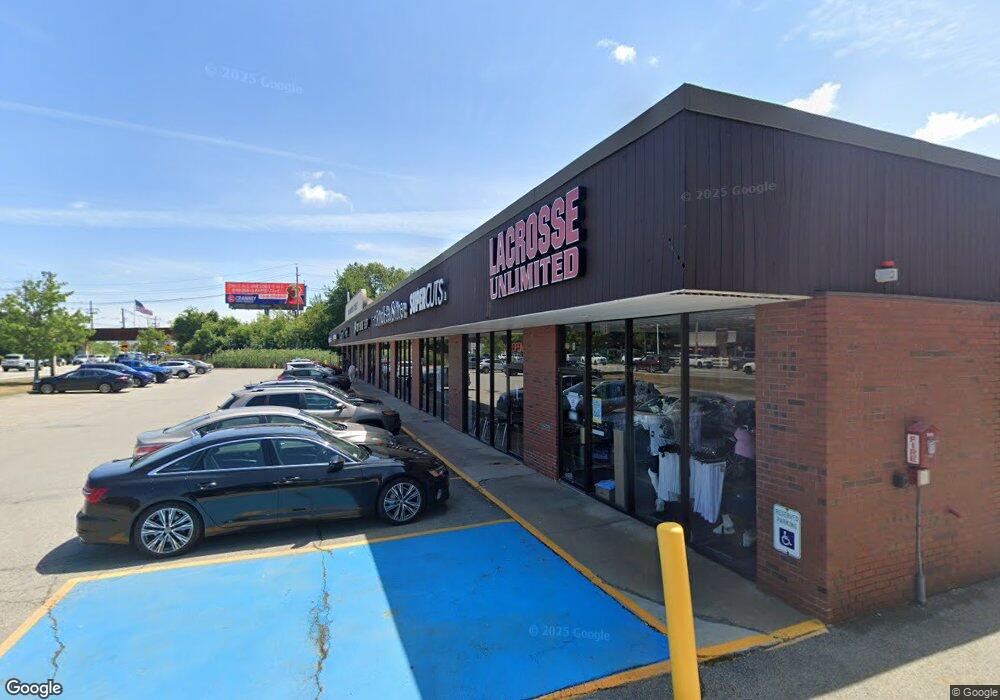
136 Andover St Danvers, MA 01923
Estimated Value: $9,703,145
--
Bed
--
Bath
16,444
Sq Ft
$590/Sq Ft
Est. Value
About This Home
This home is located at 136 Andover St, Danvers, MA 01923 and is currently estimated at $9,703,145, approximately $590 per square foot. 136 Andover St is a home located in Essex County with nearby schools including Danvers High School, St. Mary of the Annunciation School, and Plumfield Academy.
Ownership History
Date
Name
Owned For
Owner Type
Purchase Details
Closed on
Mar 7, 1990
Sold by
Thompson Charles M
Bought by
Amberwood Dev Tr
Current Estimated Value
Create a Home Valuation Report for This Property
The Home Valuation Report is an in-depth analysis detailing your home's value as well as a comparison with similar homes in the area
Home Values in the Area
Average Home Value in this Area
Purchase History
| Date | Buyer | Sale Price | Title Company |
|---|---|---|---|
| Amberwood Dev Tr | $2,280,000 | -- |
Source: Public Records
Mortgage History
| Date | Status | Borrower | Loan Amount |
|---|---|---|---|
| Open | Amberwood Dev Tr | $1,350,000 | |
| Closed | Amberwood Dev Tr | $1,700,000 |
Source: Public Records
Tax History Compared to Growth
Tax History
| Year | Tax Paid | Tax Assessment Tax Assessment Total Assessment is a certain percentage of the fair market value that is determined by local assessors to be the total taxable value of land and additions on the property. | Land | Improvement |
|---|---|---|---|---|
| 2025 | $81,368 | $4,330,400 | $2,916,800 | $1,413,600 |
| 2024 | $85,774 | $4,611,500 | $2,822,700 | $1,788,800 |
| 2023 | $83,978 | $4,203,100 | $2,446,300 | $1,756,800 |
| 2022 | $82,951 | $4,038,500 | $2,281,700 | $1,756,800 |
| 2021 | $80,290 | $3,755,400 | $2,070,000 | $1,685,400 |
| 2020 | $78,000 | $3,755,400 | $2,070,000 | $1,685,400 |
| 2019 | $75,589 | $3,567,200 | $1,881,800 | $1,685,400 |
| 2018 | $74,560 | $3,525,300 | $1,881,800 | $1,643,500 |
| 2017 | $68,780 | $3,150,700 | $1,599,500 | $1,551,200 |
| 2016 | $67,330 | $3,150,700 | $1,599,500 | $1,551,200 |
| 2015 | $61,790 | $2,884,700 | $1,458,400 | $1,426,300 |
Source: Public Records
Map
Nearby Homes
- 8 Ledgewood Way Unit 20
- 8 Ledgewood Way Unit 17
- 7 Ledgewood Way Unit 11
- 50 Village Post Rd Unit 50
- 20 Collins St Unit B
- 12 Ledgewood Way Unit 26
- 278 Newbury St Unit 10
- 267 Centre St
- 22 Collins St Unit 31
- 96 Newbury St Unit 6B
- 53 Centre St
- 286 Newbury St Unit 110
- 286 Newbury St Unit 52
- 251 Newbury St Unit 7
- 14 Bourbon St Unit 25
- 103 Newbury St Unit 3
- 98 Newbury St Unit 4B
- 72 Collins St
- 252 Newbury St Unit 71
- 252 Newbury St Unit 1
- 195 Andover St
- 140 Andover St
- 99999 Andover St
- 000 Andover St
- 00 Andover St
- 42 Garden St
- 45 Garden St
- 156 Andover St Unit 1
- 156 Andover St Unit 6
- 156 Andover St Unit 4
- 156 Andover St Unit 210
- 156 Andover St Unit S200
- 156 Andover St Unit 3
- 156 Andover St
- 156 Andover St Unit 2
- 120 Andover St
- 120 Andover St Unit 3
- 40 Garden St
- 41 Garden St
- 44 Garden St Unit 1