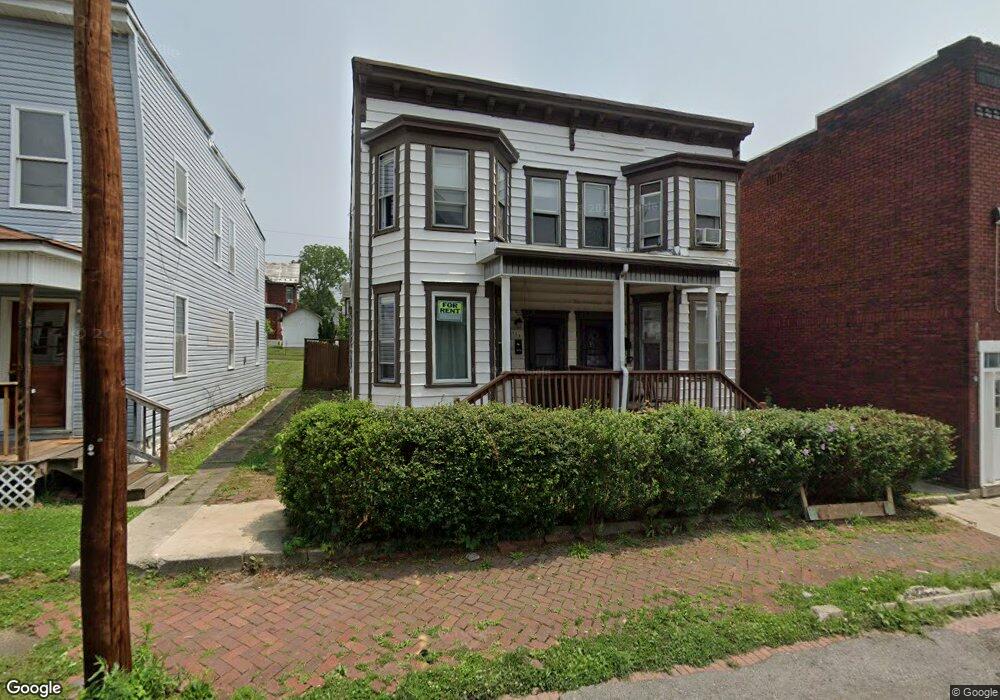
136 Arch St Cumberland, MD 21502
Estimated Value: $126,000 - $141,338
3
Beds
1
Bath
2,296
Sq Ft
$58/Sq Ft
Est. Value
About This Home
This home is located at 136 Arch St, Cumberland, MD 21502 and is currently estimated at $132,335, approximately $57 per square foot. 136 Arch St is a home located in Allegany County with nearby schools including South Penn Elementary School, Washington Middle School, and Fort Hill High School.
Ownership History
Date
Name
Owned For
Owner Type
Purchase Details
Closed on
Jul 2, 2024
Sold by
Its A Blessing Llc
Bought by
10 Universal Llc
Current Estimated Value
Home Financials for this Owner
Home Financials are based on the most recent Mortgage that was taken out on this home.
Original Mortgage
$97,500
Outstanding Balance
$96,306
Interest Rate
6.86%
Mortgage Type
New Conventional
Estimated Equity
$36,029
Purchase Details
Closed on
Sep 26, 2019
Sold by
Rianbow Butterflies Llc
Bought by
It S A Blessing Llc
Purchase Details
Closed on
Oct 23, 2017
Sold by
Butts Joann
Bought by
Ritchey Lorrie
Purchase Details
Closed on
Mar 16, 1984
Sold by
Whaley Maurice E
Bought by
Chance Stephen L-Annalee
Home Financials for this Owner
Home Financials are based on the most recent Mortgage that was taken out on this home.
Original Mortgage
$17,000
Interest Rate
13.37%
Create a Home Valuation Report for This Property
The Home Valuation Report is an in-depth analysis detailing your home's value as well as a comparison with similar homes in the area
Purchase History
| Date | Buyer | Sale Price | Title Company |
|---|---|---|---|
| 10 Universal Llc | $130,000 | None Listed On Document | |
| 10 Universal Llc | $130,000 | None Listed On Document | |
| It S A Blessing Llc | $20,000 | Security American Title Llc | |
| Ritchey Lorrie | -- | Aiiegheny Highlads Tite & Se | |
| Chance Stephen L-Annalee | $27,000 | -- |
Source: Public Records
Mortgage History
| Date | Status | Borrower | Loan Amount |
|---|---|---|---|
| Open | 10 Universal Llc | $97,500 | |
| Closed | 10 Universal Llc | $97,500 | |
| Previous Owner | Chance Stephen L-Annalee | $17,000 |
Source: Public Records
Tax History
| Year | Tax Paid | Tax Assessment Tax Assessment Total Assessment is a certain percentage of the fair market value that is determined by local assessors to be the total taxable value of land and additions on the property. | Land | Improvement |
|---|---|---|---|---|
| 2025 | $641 | $69,967 | $0 | $0 |
| 2024 | $516 | $55,133 | $0 | $0 |
| 2023 | $375 | $40,300 | $3,500 | $36,800 |
| 2022 | $338 | $36,367 | $0 | $0 |
| 2021 | $303 | $32,433 | $0 | $0 |
| 2020 | $265 | $28,500 | $3,500 | $25,000 |
| 2019 | $266 | $28,500 | $3,500 | $25,000 |
| 2018 | $269 | $28,500 | $3,500 | $25,000 |
| 2017 | $417 | $45,200 | $0 | $0 |
| 2016 | -- | $43,933 | $0 | $0 |
| 2015 | $400 | $42,667 | $0 | $0 |
| 2014 | $400 | $41,400 | $0 | $0 |
Source: Public Records
Map
Nearby Homes
Your Personal Tour Guide
Ask me questions while you tour the home.