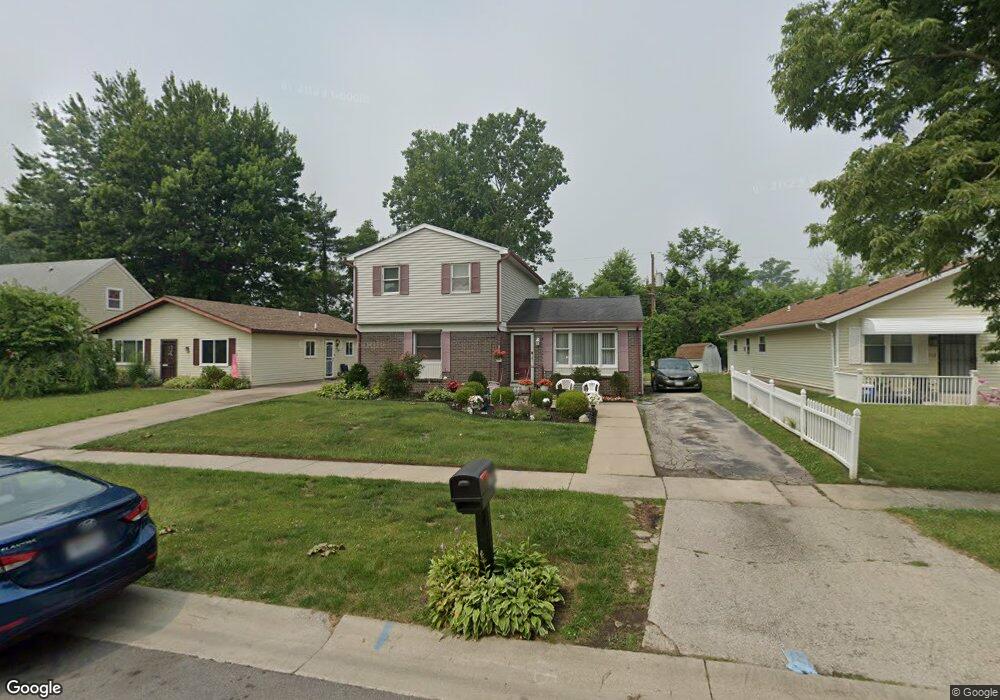
136 Arklow Dr Toledo, OH 43615
Reynolds Corners NeighborhoodEstimated Value: $147,000 - $178,000
4
Beds
2
Baths
1,625
Sq Ft
$101/Sq Ft
Est. Value
About This Home
This home is located at 136 Arklow Dr, Toledo, OH 43615 and is currently estimated at $163,736, approximately $100 per square foot. 136 Arklow Dr is a home located in Lucas County with nearby schools including McTigue Elementary School, Rogers High School, and Winterfield Venture Academy.
Ownership History
Date
Name
Owned For
Owner Type
Purchase Details
Closed on
Apr 20, 2000
Sold by
Murphy Jones Regina L
Bought by
Murphy Derrick L and Murphy Jones Regina L
Current Estimated Value
Home Financials for this Owner
Home Financials are based on the most recent Mortgage that was taken out on this home.
Original Mortgage
$66,400
Outstanding Balance
$21,382
Interest Rate
8.24%
Estimated Equity
$142,354
Purchase Details
Closed on
Mar 13, 2000
Sold by
Bank Of New York Tr
Bought by
Murphy Jones Regina L
Home Financials for this Owner
Home Financials are based on the most recent Mortgage that was taken out on this home.
Original Mortgage
$66,400
Outstanding Balance
$21,382
Interest Rate
8.24%
Estimated Equity
$142,354
Purchase Details
Closed on
Aug 26, 1998
Sold by
Western United Life Assurance
Bought by
Bank Of New York and Metropolitan Asset Funding Inc Ii Mtg Pa
Purchase Details
Closed on
Aug 18, 1994
Sold by
Western United Life
Bought by
Regina L Murphy and Regina Jones
Create a Home Valuation Report for This Property
The Home Valuation Report is an in-depth analysis detailing your home's value as well as a comparison with similar homes in the area
Home Values in the Area
Average Home Value in this Area
Purchase History
| Date | Buyer | Sale Price | Title Company |
|---|---|---|---|
| Murphy Derrick L | -- | A.R.E.A. Title Agency Inc | |
| Murphy Jones Regina L | $40,000 | A.R.E.A. Title Agency Inc | |
| Bank Of New York | $34,700 | -- | |
| Regina L Murphy | $40,000 | -- |
Source: Public Records
Mortgage History
| Date | Status | Borrower | Loan Amount |
|---|---|---|---|
| Open | Murphy Jones Regina L | $66,400 |
Source: Public Records
Tax History
| Year | Tax Paid | Tax Assessment Tax Assessment Total Assessment is a certain percentage of the fair market value that is determined by local assessors to be the total taxable value of land and additions on the property. | Land | Improvement |
|---|---|---|---|---|
| 2025 | -- | $41,020 | $5,390 | $35,630 |
| 2024 | $1,261 | $41,020 | $5,390 | $35,630 |
| 2023 | $2,067 | $31,920 | $4,200 | $27,720 |
| 2022 | $2,060 | $31,920 | $4,200 | $27,720 |
| 2021 | $2,108 | $31,920 | $4,200 | $27,720 |
| 2020 | $2,036 | $27,160 | $3,570 | $23,590 |
| 2019 | $1,989 | $27,160 | $3,570 | $23,590 |
| 2018 | $1,881 | $27,160 | $3,570 | $23,590 |
| 2017 | $1,794 | $23,065 | $4,655 | $18,410 |
| 2016 | $1,791 | $65,900 | $13,300 | $52,600 |
| 2015 | $1,775 | $65,900 | $13,300 | $52,600 |
| 2014 | $2,176 | $23,070 | $4,660 | $18,410 |
| 2013 | $1,451 | $23,070 | $4,660 | $18,410 |
Source: Public Records
Map
Nearby Homes
- 27 Harmony Ln
- 4415 Cape Ln
- 56 Dunderry Ln
- 82 San Rafael Ave
- 56 Bloomfield Ave
- 5001 South Ave Unit Lot 74
- 630 Carver Blvd
- 806 Clifton Blvd
- 706 Carver Blvd
- 710 Hilltop Ln
- 4327 Glann Rd
- 340 S Reynolds Rd Unit 97
- 340 S Reynolds Rd Unit 62
- 340 S Reynolds Rd Unit 111
- 340 S Reynolds Rd Unit 94
- 340 S Reynolds Rd Unit 49
- 340 S Reynolds Rd Unit 319
- 340 S Reynolds Rd Unit 53
- 1168 Country Creek Ln
- 5001 Golden Rd
Your Personal Tour Guide
Ask me questions while you tour the home.