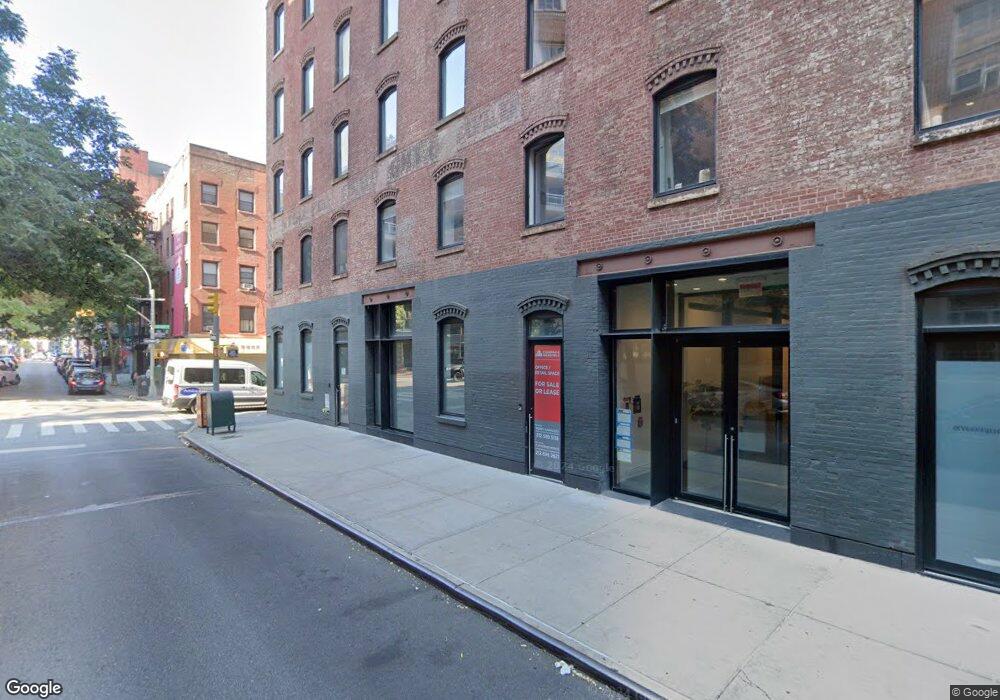
136 Baxter St Unit 4A4B New York, NY 10013
Little Italy NeighborhoodEstimated Value: $3,883,011 - $5,125,000
--
Bed
--
Bath
2,575
Sq Ft
$1,789/Sq Ft
Est. Value
About This Home
This home is located at 136 Baxter St Unit 4A4B, New York, NY 10013 and is currently estimated at $4,605,503, approximately $1,788 per square foot. 136 Baxter St Unit 4A4B is a home located in New York County with nearby schools including P.S. 130 - Hernando De Soto, M.S. 131 Dr. Sun Yat Sen, and Clinton School.
Ownership History
Date
Name
Owned For
Owner Type
Purchase Details
Closed on
Apr 18, 2024
Sold by
Gavin Nicholas H and Thormann Katrin
Bought by
Casitas Pass Llc
Current Estimated Value
Purchase Details
Closed on
Jan 5, 2021
Sold by
Feinberg China and Feinberg Jonathan
Bought by
Gavin Nicholas H and Thornmann Katrin
Home Financials for this Owner
Home Financials are based on the most recent Mortgage that was taken out on this home.
Original Mortgage
$2,999,999
Interest Rate
2.71%
Mortgage Type
Purchase Money Mortgage
Purchase Details
Closed on
Dec 22, 2017
Sold by
Gordon Kiendl
Bought by
Feinberg China and Feinberg Jonathan
Purchase Details
Closed on
Sep 10, 2008
Sold by
209-211 Hester Street Llc
Bought by
Gordon Kiendl
Create a Home Valuation Report for This Property
The Home Valuation Report is an in-depth analysis detailing your home's value as well as a comparison with similar homes in the area
Home Values in the Area
Average Home Value in this Area
Purchase History
| Date | Buyer | Sale Price | Title Company |
|---|---|---|---|
| Casitas Pass Llc | $4,800,000 | -- | |
| Casitas Pass Llc | $4,800,000 | -- | |
| Gavin Nicholas H | $3,750,000 | -- | |
| Gavin Nicholas H | $3,750,000 | -- | |
| Feinberg China | $3,500,000 | -- | |
| Feinberg China | $3,500,000 | -- | |
| Gordon Kiendl | $3,500,000 | -- | |
| Gordon Kiendl | $3,500,000 | -- |
Source: Public Records
Mortgage History
| Date | Status | Borrower | Loan Amount |
|---|---|---|---|
| Previous Owner | Gavin Nicholas H | $2,999,999 |
Source: Public Records
Tax History Compared to Growth
Tax History
| Year | Tax Paid | Tax Assessment Tax Assessment Total Assessment is a certain percentage of the fair market value that is determined by local assessors to be the total taxable value of land and additions on the property. | Land | Improvement |
|---|---|---|---|---|
| 2025 | $41,835 | $337,608 | $37,579 | $300,029 |
| 2024 | $41,835 | $334,625 | $37,579 | $297,046 |
| 2023 | $33,611 | $332,118 | $37,579 | $294,539 |
| 2022 | $39,436 | $322,324 | $37,579 | $284,745 |
| 2021 | $39,537 | $322,301 | $37,579 | $284,722 |
| 2020 | $27,440 | $361,105 | $37,579 | $323,526 |
| 2019 | $41,786 | $357,178 | $37,579 | $319,599 |
| 2018 | $41,080 | $325,396 | $37,579 | $287,817 |
| 2017 | $40,461 | $331,078 | $37,579 | $293,499 |
| 2016 | $39,972 | $331,956 | $37,579 | $294,377 |
| 2015 | $15,026 | $324,696 | $37,579 | $287,117 |
| 2014 | $15,026 | $326,628 | $37,578 | $289,050 |
Source: Public Records
Map
Nearby Homes
- 123 Baxter St Unit 4A
- 133 Mulberry St Unit 4C
- 133 Mulberry St Unit 2A
- 185 Grand St Unit 6 C
- 185 Grand St Unit 2B
- 129 Lafayette St Unit 8C
- 141 Grand St
- 210 Canal St Unit 510
- 240 Centre St Unit 2K
- 240 Centre St Unit 3J
- 240 Centre St Unit 3-B
- 53 Elizabeth St Unit 4-A
- 274 Canal St
- 83 Walker St Unit 4
- 80 Elizabeth St
- 30 Crosby St Unit 4B
- 30 Crosby St Unit 4A
- 395 Broadway Unit 4E
- 395 Broadway Unit 7E
- 210 Lafayette St Unit 7D
- 136 Baxter St
- 136 Baxter St
- 136 Baxter St Unit 5C
- 136 Baxter St Unit 5B
- 136 Baxter St Unit 5A
- 136 Baxter St Unit 4C
- 136 Baxter St Unit 3A3B
- 136 Baxter St Unit 2C
- 136 Baxter St Unit 2B
- 136 Baxter St Unit 2A
- 136 Baxter St Unit None
- 136 Baxter St Unit PHS
- 136 Baxter St Unit PHB
- 136 Baxter St Unit B
- 136 Baxter St Unit 1C
- 136 Baxter St Unit A
- 136 Baxter St Unit 5B/6B
- 136 Baxter St Unit 3AB
- 136 Baxter St Unit 7A
- 136 Baxter St Unit 5-6B