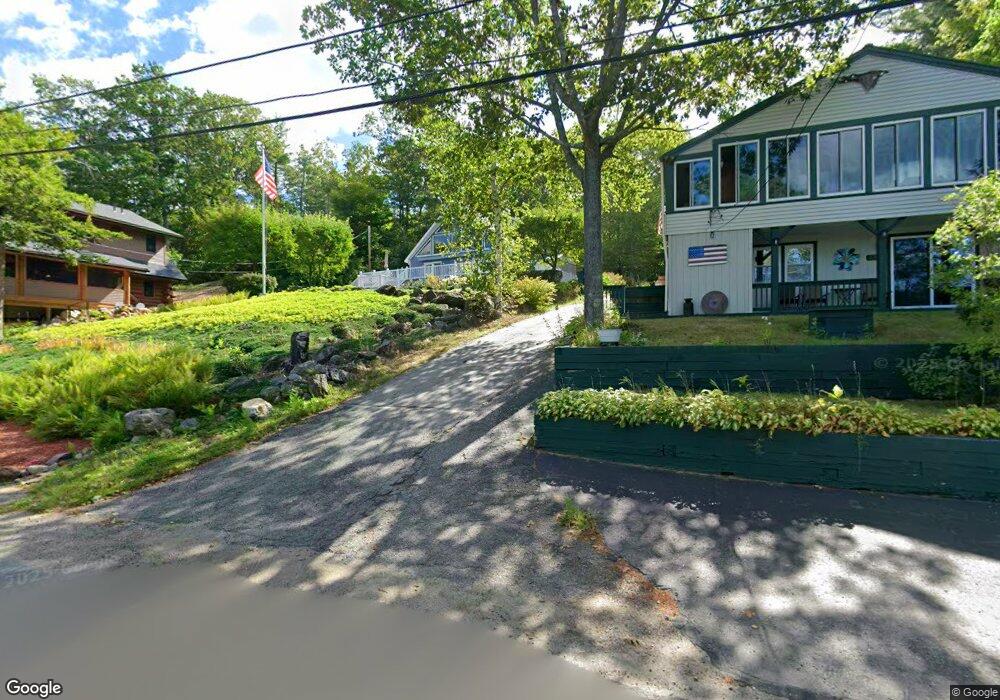
136 Beachview Dr Winchendon, MA 01475
Estimated Value: $457,000 - $619,000
3
Beds
2
Baths
1,824
Sq Ft
$287/Sq Ft
Est. Value
About This Home
This home is located at 136 Beachview Dr, Winchendon, MA 01475 and is currently estimated at $524,109, approximately $287 per square foot. 136 Beachview Dr is a home located in Worcester County with nearby schools including Memorial, Toy Town Elementary School, and Heritage Christian School.
Ownership History
Date
Name
Owned For
Owner Type
Purchase Details
Closed on
Jan 23, 2019
Sold by
Levesque Gloria A
Bought by
136 Beachview Drive Rt and Levesque
Current Estimated Value
Purchase Details
Closed on
Nov 2, 1998
Sold by
Bingham David R and Bingham Anita L
Bought by
Levesque Gloria A
Home Financials for this Owner
Home Financials are based on the most recent Mortgage that was taken out on this home.
Original Mortgage
$155,250
Interest Rate
6.68%
Mortgage Type
Purchase Money Mortgage
Purchase Details
Closed on
Sep 5, 1996
Sold by
Esmond Barbara C
Bought by
Bingham David and Bingham Anita
Home Financials for this Owner
Home Financials are based on the most recent Mortgage that was taken out on this home.
Original Mortgage
$126,400
Interest Rate
8.11%
Mortgage Type
Purchase Money Mortgage
Create a Home Valuation Report for This Property
The Home Valuation Report is an in-depth analysis detailing your home's value as well as a comparison with similar homes in the area
Home Values in the Area
Average Home Value in this Area
Purchase History
| Date | Buyer | Sale Price | Title Company |
|---|---|---|---|
| 136 Beachview Drive Rt | -- | -- | |
| 136 Beachview Drive Rt | -- | -- | |
| Levesque Gloria A | $172,500 | -- | |
| Levesque Gloria A | $172,500 | -- | |
| Bingham David | $158,000 | -- | |
| Bingham David | $158,000 | -- |
Source: Public Records
Mortgage History
| Date | Status | Borrower | Loan Amount |
|---|---|---|---|
| Previous Owner | Bingham David | $138,200 | |
| Previous Owner | Bingham David | $155,250 | |
| Previous Owner | Bingham David | $126,400 |
Source: Public Records
Tax History Compared to Growth
Tax History
| Year | Tax Paid | Tax Assessment Tax Assessment Total Assessment is a certain percentage of the fair market value that is determined by local assessors to be the total taxable value of land and additions on the property. | Land | Improvement |
|---|---|---|---|---|
| 2025 | $4,586 | $390,300 | $111,100 | $279,200 |
| 2024 | $4,622 | $368,600 | $107,500 | $261,100 |
| 2023 | $4,107 | $306,500 | $107,500 | $199,000 |
| 2022 | $4,328 | $286,400 | $107,200 | $179,200 |
| 2021 | $4,702 | $299,100 | $100,000 | $199,100 |
| 2020 | $4,588 | $281,800 | $98,200 | $183,600 |
| 2019 | $4,405 | $263,600 | $89,600 | $174,000 |
| 2018 | $4,860 | $280,100 | $114,700 | $165,400 |
| 2017 | $4,974 | $276,800 | $119,100 | $157,700 |
| 2016 | $4,527 | $259,700 | $108,000 | $151,700 |
| 2015 | $4,342 | $259,700 | $108,000 | $151,700 |
| 2014 | $4,340 | $271,900 | $126,000 | $145,900 |
Source: Public Records
Map
Nearby Homes
- 146 Beachview Dr
- 126 Beachview Dr
- 116 Beachview Dr
- 156 Beachview Dr
- 166 Beachview Dr
- 106 Beachview Dr
- 5 Monomonac Rd E
- 0 Beachview Dr
- 176 Beachview Dr
- LOT 3 Monomonac Rd E
- 185 Beachview Dr
- 95 Beachview Dr
- 6 Monomonac Rd E
- 6 Monomonac Rd E
- 85 Beachview Dr
- 195 Beachview Dr
- 16 Monomonac Rd E
- 26 Sunny Cove Rd
- 75 Beachview Dr
- 25 Monomonac Rd E