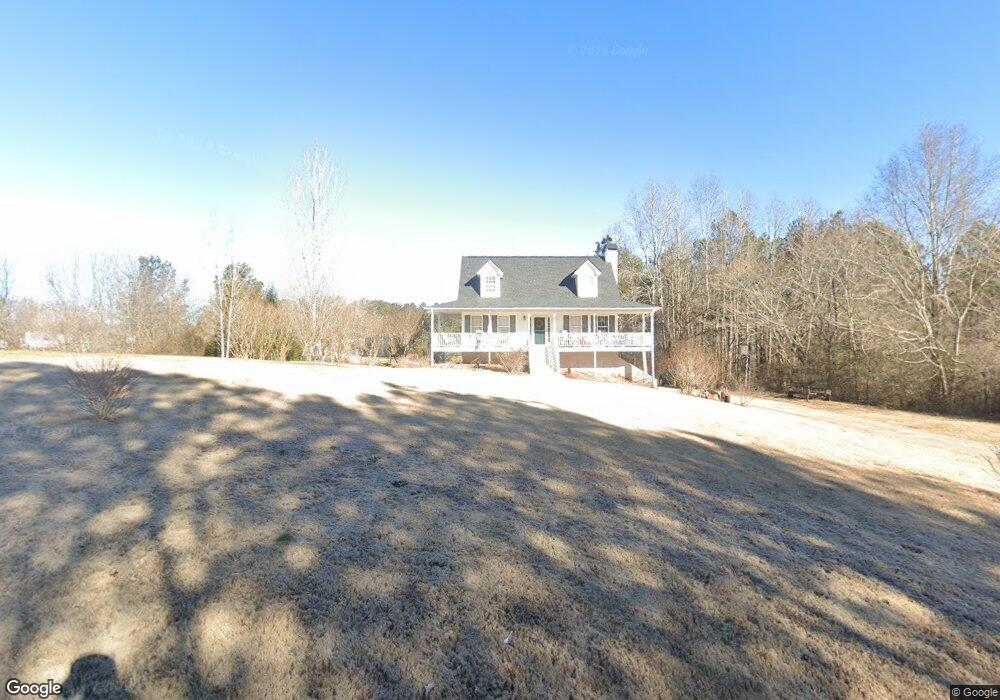
136 Chrissy Dr Temple, GA 30179
Estimated Value: $270,000 - $302,000
3
Beds
2
Baths
1,352
Sq Ft
$210/Sq Ft
Est. Value
About This Home
This home is located at 136 Chrissy Dr, Temple, GA 30179 and is currently estimated at $283,590, approximately $209 per square foot. 136 Chrissy Dr is a home located in Carroll County with nearby schools including Providence Elementary School, Temple Middle School, and Temple High School.
Ownership History
Date
Name
Owned For
Owner Type
Purchase Details
Closed on
Oct 23, 2019
Sold by
Jeffares Jerry E
Bought by
Jeffares Jerry E and Jeffares Amanda Beth
Current Estimated Value
Home Financials for this Owner
Home Financials are based on the most recent Mortgage that was taken out on this home.
Original Mortgage
$151,439
Outstanding Balance
$131,000
Interest Rate
3.5%
Mortgage Type
FHA
Estimated Equity
$152,590
Purchase Details
Closed on
Jun 25, 2002
Sold by
Thompson Family Homes Inc
Bought by
Jeffares Jerry E and Jeffares Linda M
Purchase Details
Closed on
Mar 4, 2002
Sold by
Dobbins Terry Inc
Bought by
Thompson Family Homes Inc
Purchase Details
Closed on
Jun 29, 2001
Bought by
Dobbins Terry Inc
Create a Home Valuation Report for This Property
The Home Valuation Report is an in-depth analysis detailing your home's value as well as a comparison with similar homes in the area
Home Values in the Area
Average Home Value in this Area
Purchase History
| Date | Buyer | Sale Price | Title Company |
|---|---|---|---|
| Jeffares Jerry E | -- | -- | |
| Jeffares Jerry E | $132,400 | -- | |
| Thompson Family Homes Inc | $30,500 | -- | |
| Dobbins Terry Inc | -- | -- |
Source: Public Records
Mortgage History
| Date | Status | Borrower | Loan Amount |
|---|---|---|---|
| Open | Jeffares Jerry E | $151,439 |
Source: Public Records
Tax History
| Year | Tax Paid | Tax Assessment Tax Assessment Total Assessment is a certain percentage of the fair market value that is determined by local assessors to be the total taxable value of land and additions on the property. | Land | Improvement |
|---|---|---|---|---|
| 2025 | $220 | $93,799 | $9,600 | $84,199 |
| 2024 | $223 | $93,799 | $9,600 | $84,199 |
| 2023 | $223 | $86,504 | $9,600 | $76,904 |
| 2022 | $265 | $71,330 | $9,600 | $61,730 |
| 2021 | $268 | $62,530 | $9,600 | $52,930 |
| 2020 | $269 | $56,878 | $9,600 | $47,278 |
| 2019 | $276 | $53,330 | $9,600 | $43,730 |
| 2018 | $289 | $48,027 | $9,600 | $38,427 |
| 2017 | $292 | $47,627 | $9,600 | $38,027 |
| 2016 | $292 | $47,627 | $9,600 | $38,027 |
| 2015 | $295 | $43,023 | $9,600 | $33,424 |
| 2014 | $297 | $43,024 | $9,600 | $33,424 |
Source: Public Records
Map
Nearby Homes
- 415 Old Draketown Trail
- 223 Sunlight Cove
- 100 Gordons Lake Dr
- 0 Old Draketown Trail Unit 10668385
- 0 Old Draketown Trail Unit 7700911
- 21 + - Acres On Allgood Church Rd
- 217 Browning Rd
- 150 Charles Painter Rd
- 141 Governor Ln
- 2693 Highway 101 S
- 122 Wesley Chapel Ln
- 118 Raven Rd
- 410 Nottely Dr
- 411 Nottely Dr
- 101 Robindale Ln
- 0 Glenn Helton Rd Unit 7719849
- 0 Glenn Helton Rd Unit 10692190
- 133 Pebblebrook Way
- 139 Clover Ct
- 104 Federal Path
Your Personal Tour Guide
Ask me questions while you tour the home.