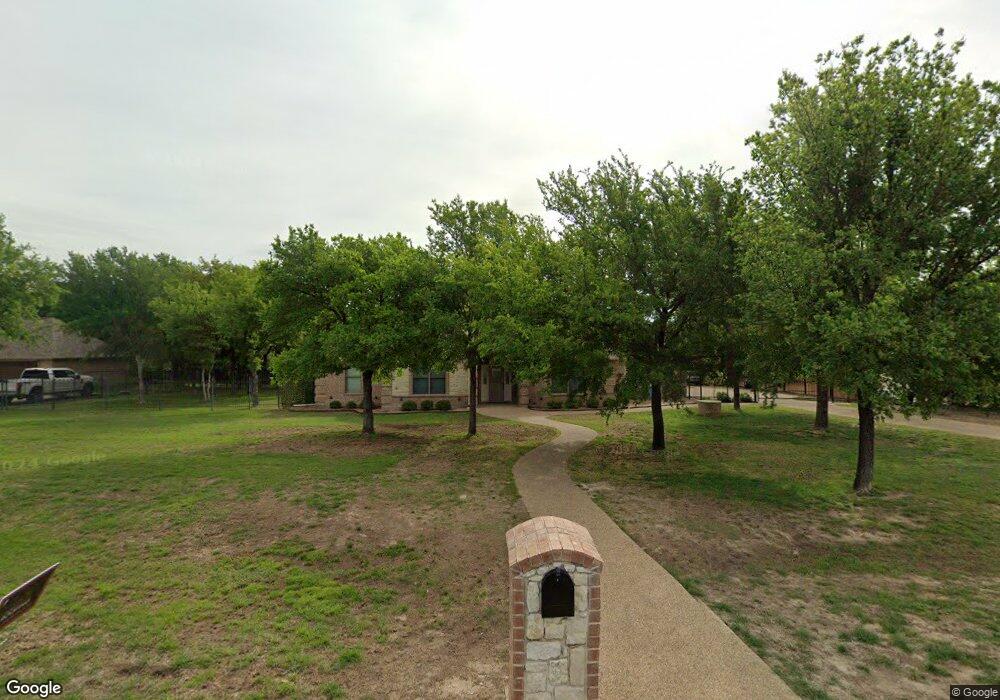
136 Crown Ridge Ct Fort Worth, TX 76108
Far West Fort Worth NeighborhoodEstimated Value: $693,000 - $768,000
4
Beds
4
Baths
3,136
Sq Ft
$236/Sq Ft
Est. Value
About This Home
This home is located at 136 Crown Ridge Ct, Fort Worth, TX 76108 and is currently estimated at $740,604, approximately $236 per square foot. 136 Crown Ridge Ct is a home located in Parker County with nearby schools including Silver Creek Elementary School, Azle Elementary School, and Azle Junior High School.
Ownership History
Date
Name
Owned For
Owner Type
Purchase Details
Closed on
May 31, 2019
Sold by
Johnson Marcus and Johnson Michelle Coleman
Bought by
Monaghan Patrick Joseph and Monaghan Pamela Anne
Current Estimated Value
Home Financials for this Owner
Home Financials are based on the most recent Mortgage that was taken out on this home.
Original Mortgage
$110,000
Outstanding Balance
$71,026
Interest Rate
4.1%
Mortgage Type
New Conventional
Estimated Equity
$669,578
Purchase Details
Closed on
Aug 25, 2014
Sold by
Lee Anthony and Lee Kathleen Kehoe
Bought by
Johnson Marcus
Purchase Details
Closed on
Dec 2, 2009
Sold by
Toulouse Mark G and Toulouse Jeffica L
Bought by
Johnson Marcus and Johnson Michelle Coleman
Home Financials for this Owner
Home Financials are based on the most recent Mortgage that was taken out on this home.
Original Mortgage
$296,000
Interest Rate
5.06%
Mortgage Type
New Conventional
Create a Home Valuation Report for This Property
The Home Valuation Report is an in-depth analysis detailing your home's value as well as a comparison with similar homes in the area
Home Values in the Area
Average Home Value in this Area
Purchase History
| Date | Buyer | Sale Price | Title Company |
|---|---|---|---|
| Monaghan Patrick Joseph | -- | Alamo Title Company | |
| Johnson Marcus | -- | None Available | |
| Johnson Marcus | -- | Alamo Title Company |
Source: Public Records
Mortgage History
| Date | Status | Borrower | Loan Amount |
|---|---|---|---|
| Open | Monaghan Patrick Joseph | $110,000 | |
| Previous Owner | Johnson Marcus | $296,000 |
Source: Public Records
Tax History Compared to Growth
Tax History
| Year | Tax Paid | Tax Assessment Tax Assessment Total Assessment is a certain percentage of the fair market value that is determined by local assessors to be the total taxable value of land and additions on the property. | Land | Improvement |
|---|---|---|---|---|
| 2025 | $3,223 | $634,766 | -- | -- |
| 2024 | $3,223 | $577,060 | -- | -- |
| 2023 | $3,223 | $524,600 | $0 | $0 |
| 2022 | $8,825 | $476,910 | $75,000 | $401,910 |
| 2021 | $9,246 | $476,910 | $75,000 | $401,910 |
| 2020 | $8,811 | $456,910 | $55,000 | $401,910 |
| 2019 | $8,930 | $436,910 | $55,000 | $381,910 |
| 2018 | $8,151 | $397,590 | $55,000 | $342,590 |
| 2017 | $7,359 | $397,590 | $55,000 | $342,590 |
| 2016 | $6,690 | $342,440 | $55,000 | $287,440 |
| 2015 | $2,467 | $342,440 | $55,000 | $287,440 |
| 2014 | -- | $334,260 | $55,000 | $279,260 |
Source: Public Records
Map
Nearby Homes
- 142 Crown Ridge Ct
- 100 Stone Canyon Cir
- 108 Stone Canyon Cir
- 141 E Bozeman Ln
- 175 N Boyce Ln
- 101 E Bozeman Ln
- 200 W Bozeman Ln
- 420 Cattlebaron Parc Dr
- 301 Silver Canyon Dr
- 313 Silver Canyon Dr
- 813 Remuda Dr
- 741 Remuda Dr
- 900 Reese Ln
- 104 Woodview Creek Trail
- 694 Boling Ranch Rd
- 1144 Boling Ranch Rd N
- 1144 Rd
- 129 Lariat Ct
- 742 Boling Ranch Rd
- 332 Tiara Trail
- 136 Crown Ridge Ct Unit COURT
- 130 Crown Ridge Ct
- 133 Crown Ridge Ct
- 141 Crown Ridge Ct
- 124 Crown Ridge Ct
- 148 Crown Ridge Ct
- 118 Crown Ridge Ct
- 149 Crown Ridge Ct
- 111 Crown Ridge Ct
- 112 Crown Ridge Ct
- 156 Crown Ridge Ct
- 199 Tyler Ct
- 1141 Colina Dr
- 152 Crown Ridge Ct
- 145 Crown Ridge Ct
- 160 Crown Ridge Ct
- 153 Crown Ridge Ct
- 153 Crown Ridge Ct Unit COURT
- 106 Crown Ridge Ct
- 103 Crown Ridge Ct