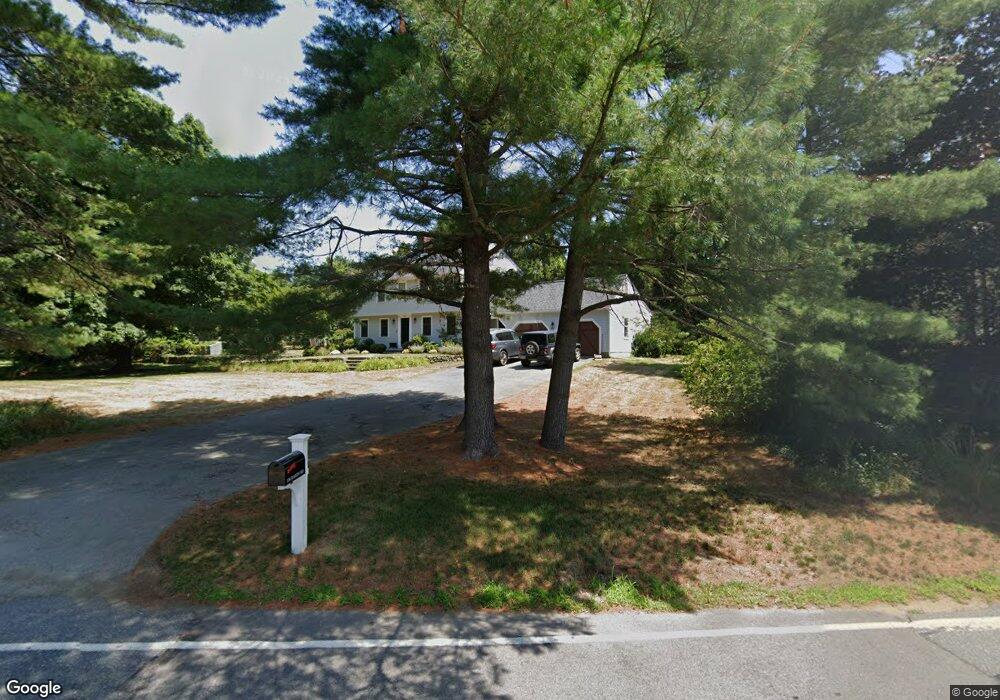
136 Dakin Rd Sudbury, MA 01776
Estimated Value: $1,153,796 - $1,360,000
4
Beds
3
Baths
3,394
Sq Ft
$371/Sq Ft
Est. Value
About This Home
This home is located at 136 Dakin Rd, Sudbury, MA 01776 and is currently estimated at $1,258,449, approximately $370 per square foot. 136 Dakin Rd is a home located in Middlesex County with nearby schools including Josiah Haynes Elementary School, Ephraim Curtis Middle School, and Lincoln-Sudbury Regional High School.
Ownership History
Date
Name
Owned For
Owner Type
Purchase Details
Closed on
Dec 28, 2010
Sold by
Meeks Joseph L and Meeks Gretchen W
Bought by
Riquier Geoffry T and Riquier Alison
Current Estimated Value
Home Financials for this Owner
Home Financials are based on the most recent Mortgage that was taken out on this home.
Original Mortgage
$523,750
Outstanding Balance
$341,078
Interest Rate
4.17%
Mortgage Type
Purchase Money Mortgage
Estimated Equity
$917,371
Purchase Details
Closed on
Dec 14, 1993
Sold by
Lentros Cynthia
Bought by
Meeks Joseph L and Meeks Gretchen W
Purchase Details
Closed on
Jan 8, 1992
Sold by
Lentros Cynthia
Bought by
Delaney William J
Create a Home Valuation Report for This Property
The Home Valuation Report is an in-depth analysis detailing your home's value as well as a comparison with similar homes in the area
Home Values in the Area
Average Home Value in this Area
Purchase History
| Date | Buyer | Sale Price | Title Company |
|---|---|---|---|
| Riquier Geoffry T | $719,000 | -- | |
| Riquier Geoffry T | $719,000 | -- | |
| Meeks Joseph L | $330,000 | -- | |
| Meeks Joseph L | $330,000 | -- | |
| Delaney William J | $129,032 | -- | |
| Delaney William J | $129,032 | -- |
Source: Public Records
Mortgage History
| Date | Status | Borrower | Loan Amount |
|---|---|---|---|
| Open | Riquier Geoffry T | $523,750 | |
| Closed | Delaney William J | $84,000 |
Source: Public Records
Tax History
| Year | Tax Paid | Tax Assessment Tax Assessment Total Assessment is a certain percentage of the fair market value that is determined by local assessors to be the total taxable value of land and additions on the property. | Land | Improvement |
|---|---|---|---|---|
| 2025 | $15,275 | $1,043,400 | $439,600 | $603,800 |
| 2024 | $14,704 | $1,006,400 | $426,800 | $579,600 |
| 2023 | $13,878 | $880,000 | $395,200 | $484,800 |
| 2022 | $13,684 | $758,100 | $362,800 | $395,300 |
| 2021 | $13,072 | $694,200 | $362,800 | $331,400 |
| 2020 | $12,808 | $694,200 | $362,800 | $331,400 |
| 2019 | $12,433 | $694,200 | $362,800 | $331,400 |
| 2018 | $12,356 | $689,100 | $386,800 | $302,300 |
| 2017 | $11,840 | $667,400 | $368,000 | $299,400 |
| 2016 | $11,476 | $644,700 | $354,000 | $290,700 |
| 2015 | $11,004 | $625,200 | $340,400 | $284,800 |
| 2014 | $10,987 | $609,400 | $330,400 | $279,000 |
Source: Public Records
Map
Nearby Homes
- 19 Skyview Ln
- 42 Dakin Rd
- 56 Seymour St
- 367 Powder Mill Rd
- 40 Rookery Ln Unit 5
- 72 Rookery Ln Unit 3
- 20 Cobblestone Place
- 32 Bolton St
- 401 Emery Ln Unit 408
- 56 Rookery Ln Unit 4
- 108 Hawks Perch Unit 108
- 228 Mossman Rd
- 8 Snowberry Ln
- 41 Old Coach Rd
- 68 Longfellow Rd
- 132 Williams Rd
- 96 Mossman Rd
- 377 Willis Rd
- 8-10 Concord Road (&356 Bostonpost)
- 89 Mattison Dr
- 142 Dakin Rd
- 128 Dakin Rd
- 139 Dakin Rd
- 0 Field Road (Lot 23) Unit 50490097
- 12 Field Rd
- 123 Dakin Rd
- 310 Old Pickard Rd
- 147 Dakin Rd
- 146 Dakin Rd
- 118 Dakin Rd
- 305 Old Pickard Rd
- 18 Field Rd
- 15 Field Rd
- 304 Old Pickard Rd
- 108 Dakin Rd
- 109 Dakin Rd
- 109 Dakin Rd Unit 1
- 283 Old Pickard Rd
- 28 Paddock Way
- 28 Paddock Way
Your Personal Tour Guide
Ask me questions while you tour the home.