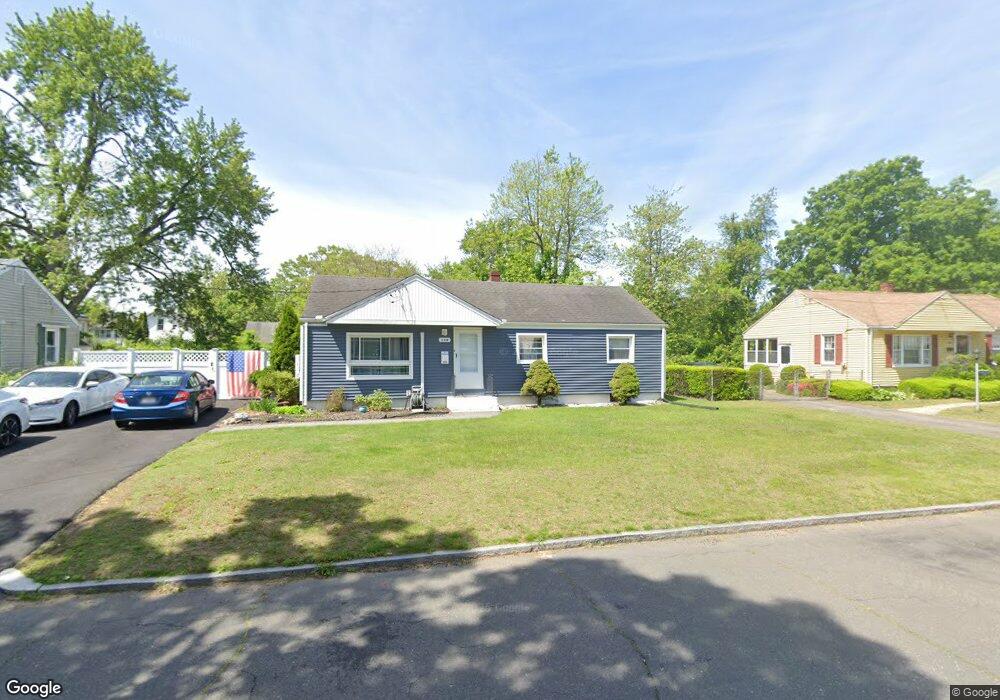
136 Drexel St Springfield, MA 01104
Liberty Heights NeighborhoodEstimated Value: $266,000 - $290,000
3
Beds
2
Baths
1,008
Sq Ft
$280/Sq Ft
Est. Value
About This Home
This home is located at 136 Drexel St, Springfield, MA 01104 and is currently estimated at $282,118, approximately $279 per square foot. 136 Drexel St is a home located in Hampden County with nearby schools including Mary O. Pottenger Elementary School, Van Sickle Academy, and Springfield Central High School.
Ownership History
Date
Name
Owned For
Owner Type
Purchase Details
Closed on
Mar 31, 1999
Sold by
Est Dechristopher G M and Dechristopher Louis
Bought by
Pena Juan C
Current Estimated Value
Home Financials for this Owner
Home Financials are based on the most recent Mortgage that was taken out on this home.
Original Mortgage
$54,959
Outstanding Balance
$13,616
Interest Rate
6.78%
Mortgage Type
Purchase Money Mortgage
Estimated Equity
$268,502
Create a Home Valuation Report for This Property
The Home Valuation Report is an in-depth analysis detailing your home's value as well as a comparison with similar homes in the area
Home Values in the Area
Average Home Value in this Area
Purchase History
| Date | Buyer | Sale Price | Title Company |
|---|---|---|---|
| Pena Juan C | $55,000 | -- |
Source: Public Records
Mortgage History
| Date | Status | Borrower | Loan Amount |
|---|---|---|---|
| Open | Pena Juan C | $54,959 |
Source: Public Records
Tax History
| Year | Tax Paid | Tax Assessment Tax Assessment Total Assessment is a certain percentage of the fair market value that is determined by local assessors to be the total taxable value of land and additions on the property. | Land | Improvement |
|---|---|---|---|---|
| 2025 | $3,319 | $211,700 | $40,400 | $171,300 |
| 2024 | $2,947 | $183,500 | $40,400 | $143,100 |
| 2023 | $2,873 | $168,500 | $35,800 | $132,700 |
| 2022 | $3,201 | $170,100 | $33,400 | $136,700 |
| 2021 | $2,629 | $139,100 | $30,400 | $108,700 |
| 2020 | $2,410 | $123,400 | $30,400 | $93,000 |
| 2019 | $2,279 | $115,800 | $33,100 | $82,700 |
| 2018 | $2,173 | $110,400 | $33,100 | $77,300 |
| 2017 | $2,113 | $107,500 | $29,900 | $77,600 |
| 2016 | $2,039 | $103,700 | $28,400 | $75,300 |
| 2015 | $1,963 | $99,800 | $28,400 | $71,400 |
Source: Public Records
Map
Nearby Homes
- 150 Drexel St
- 33 Drexel St
- 49 Upland St
- 151 Littleton St
- 27 Parallel St
- 73 Melville
- 28 Porter St
- 119 Littleton St
- 9 Utica St
- 59 Piedmont St
- 47 Victoria St
- 491-493 Newbury St
- 809 Carew St
- 143 Saint James Cir
- 393 Saint James Ave
- 83 Oklahoma St
- 102 San Miguel St
- 774-776 Liberty St
- 42 Marquette St
- 744-746 Carew St
Your Personal Tour Guide
Ask me questions while you tour the home.