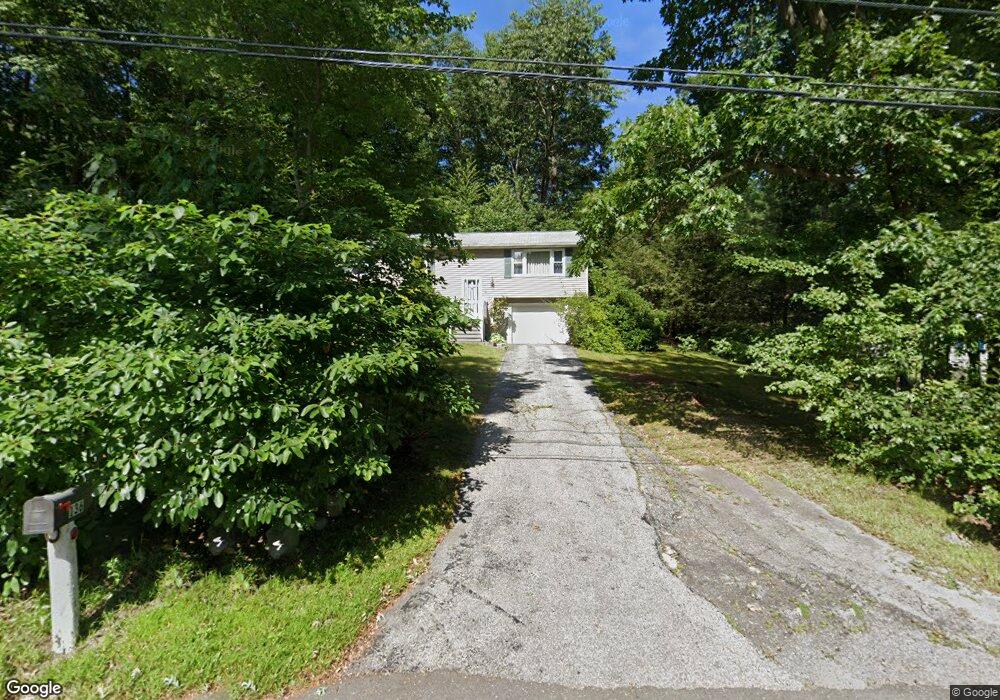
136 Dudley Rd Oxford, MA 01540
Estimated Value: $392,000 - $498,000
3
Beds
2
Baths
1,056
Sq Ft
$405/Sq Ft
Est. Value
About This Home
This home is located at 136 Dudley Rd, Oxford, MA 01540 and is currently estimated at $428,167, approximately $405 per square foot. 136 Dudley Rd is a home located in Worcester County with nearby schools including Alfred M Chaffee, Oxford High School, and Clara Barton Elementary School.
Ownership History
Date
Name
Owned For
Owner Type
Purchase Details
Closed on
Aug 27, 2001
Sold by
Gardner Kathleen J
Bought by
Bidinger Ronald E and Bidinger Bonnie J
Current Estimated Value
Home Financials for this Owner
Home Financials are based on the most recent Mortgage that was taken out on this home.
Original Mortgage
$101,000
Interest Rate
7.21%
Mortgage Type
Purchase Money Mortgage
Create a Home Valuation Report for This Property
The Home Valuation Report is an in-depth analysis detailing your home's value as well as a comparison with similar homes in the area
Home Values in the Area
Average Home Value in this Area
Purchase History
| Date | Buyer | Sale Price | Title Company |
|---|---|---|---|
| Bidinger Ronald E | $98,000 | -- |
Source: Public Records
Mortgage History
| Date | Status | Borrower | Loan Amount |
|---|---|---|---|
| Open | Bidinger Ronald E | $95,000 | |
| Closed | Bidinger Ronald E | $101,000 | |
| Previous Owner | Bidinger Ronald E | $78,000 | |
| Previous Owner | Bidinger Ronald E | $30,000 |
Source: Public Records
Tax History
| Year | Tax Paid | Tax Assessment Tax Assessment Total Assessment is a certain percentage of the fair market value that is determined by local assessors to be the total taxable value of land and additions on the property. | Land | Improvement |
|---|---|---|---|---|
| 2025 | $42 | $328,300 | $95,200 | $233,100 |
| 2024 | $3,882 | $288,000 | $88,500 | $199,500 |
| 2023 | $3,799 | $278,500 | $79,000 | $199,500 |
| 2022 | $3,413 | $211,200 | $67,300 | $143,900 |
| 2021 | $3,321 | $200,900 | $63,800 | $137,100 |
| 2020 | $3,202 | $192,200 | $63,800 | $128,400 |
| 2019 | $3,118 | $183,100 | $63,800 | $119,300 |
| 2018 | $2,969 | $171,900 | $63,800 | $108,100 |
| 2017 | $2,971 | $176,300 | $63,800 | $112,500 |
| 2016 | $2,985 | $176,300 | $63,800 | $112,500 |
| 2015 | $2,784 | $176,300 | $63,800 | $112,500 |
| 2014 | $2,730 | $182,000 | $63,800 | $118,200 |
Source: Public Records
Map
Nearby Homes
- 43 Larned Rd
- 0 Old Southbridge Rd
- 2 Bounty Rd
- 13 Harwood St
- 113 Main St
- 13 Dolge Ct
- 4 Toria Heights Rd
- 71 Charlton St
- 14 Walnut St
- 9 Howarth Rd
- 29 Charlton St
- L0T 3 History Dr
- 4 History Dr
- 2 Potter Village Rd
- 3 Lelandville Rd
- 2 Lelandville Rd
- L2 Partridge Hill Rd
- L3 Partridge Hill Rd
- 47 Main St
- 308 Main St
Your Personal Tour Guide
Ask me questions while you tour the home.