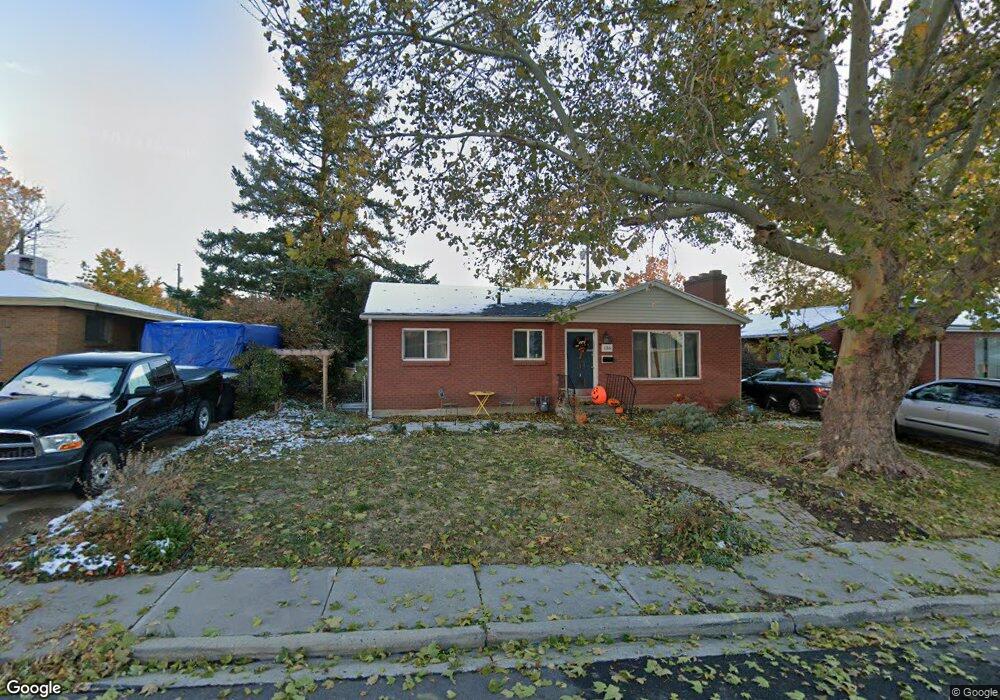
136 E 1050 N Bountiful, UT 84010
Estimated Value: $472,000 - $510,000
4
Beds
2
Baths
2,070
Sq Ft
$239/Sq Ft
Est. Value
About This Home
This home is located at 136 E 1050 N, Bountiful, UT 84010 and is currently estimated at $494,091, approximately $238 per square foot. 136 E 1050 N is a home located in Davis County with nearby schools including Tolman School, Bountiful Junior High School, and Viewmont High School.
Ownership History
Date
Name
Owned For
Owner Type
Purchase Details
Closed on
Oct 5, 2020
Sold by
Carver Adam
Bought by
Carver Nichote
Current Estimated Value
Home Financials for this Owner
Home Financials are based on the most recent Mortgage that was taken out on this home.
Original Mortgage
$279,000
Outstanding Balance
$247,594
Interest Rate
2.9%
Mortgage Type
New Conventional
Estimated Equity
$246,497
Purchase Details
Closed on
Nov 10, 2017
Sold by
Hirst James and Balley Blake
Bought by
Carver Adam and Carver Nichole
Home Financials for this Owner
Home Financials are based on the most recent Mortgage that was taken out on this home.
Original Mortgage
$286,711
Interest Rate
3.75%
Mortgage Type
FHA
Purchase Details
Closed on
Feb 27, 2017
Sold by
Graham Kathleen S
Bought by
Hirst James and Bailey Blake
Purchase Details
Closed on
Sep 14, 2016
Sold by
Graham Kathleen S
Bought by
Graham Jeff D
Purchase Details
Closed on
Apr 1, 2014
Sold by
Graham Jeff D and Graham Kathleen S
Bought by
Graham Kathleen S
Create a Home Valuation Report for This Property
The Home Valuation Report is an in-depth analysis detailing your home's value as well as a comparison with similar homes in the area
Purchase History
| Date | Buyer | Sale Price | Title Company |
|---|---|---|---|
| Carver Nichote | -- | Us Title Company Of | |
| Carver Adam | -- | North American Title | |
| Hirst James | -- | North American Title | |
| Graham Jeff D | -- | None Available | |
| Graham Kathleen S | -- | None Available |
Source: Public Records
Mortgage History
| Date | Status | Borrower | Loan Amount |
|---|---|---|---|
| Open | Carver Nichote | $279,000 | |
| Closed | Carver Adam | $286,711 |
Source: Public Records
Tax History
| Year | Tax Paid | Tax Assessment Tax Assessment Total Assessment is a certain percentage of the fair market value that is determined by local assessors to be the total taxable value of land and additions on the property. | Land | Improvement |
|---|---|---|---|---|
| 2025 | $3,197 | $257,950 | $121,628 | $136,322 |
| 2024 | $2,915 | $250,250 | $105,679 | $144,571 |
| 2023 | $2,817 | $437,000 | $197,240 | $239,760 |
| 2022 | $3,047 | $255,200 | $108,468 | $146,732 |
| 2021 | $2,495 | $361,000 | $141,834 | $219,166 |
| 2020 | $2,288 | $320,000 | $122,097 | $197,903 |
| 2019 | $2,081 | $294,000 | $135,515 | $158,485 |
| 2018 | $1,922 | $267,000 | $132,991 | $134,009 |
| 2016 | $1,546 | $115,610 | $52,919 | $62,691 |
| 2015 | $1,541 | $108,955 | $52,919 | $56,036 |
| 2014 | $1,583 | $115,551 | $52,919 | $62,632 |
| 2013 | -- | $101,602 | $40,825 | $60,777 |
Source: Public Records
Map
Nearby Homes
- 1420 N Main St
- 106 W 700 N
- 1130 N 200 W
- 1260 N 200 W
- 184 Park Shadows Cir
- 453 N 400 E Unit 7-D
- 967 S Courtyard Ln
- 235 W 1400 N
- 96 Village Square Rd
- 951 Centerville Commons Way
- 563 N 200 W
- 345 N 400 E
- 499 N 200 W Unit 30
- 252 N Main St
- 49 E 200 N Unit 4
- 41 E 200 N Unit 6
- 256 N Main St
- 254 N Main St
- 55 E 200 N Unit 2
- 51 E 200 N Unit 3
Your Personal Tour Guide
Ask me questions while you tour the home.