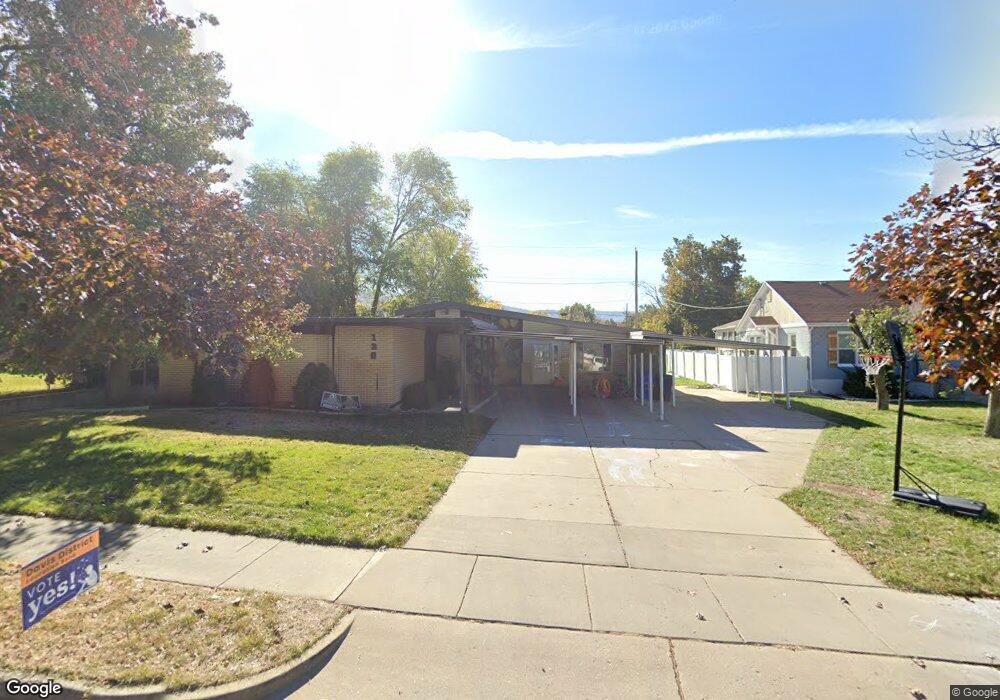
136 E 1200 S Bountiful, UT 84010
Estimated Value: $664,000 - $870,000
6
Beds
3
Baths
4,356
Sq Ft
$172/Sq Ft
Est. Value
About This Home
This home is located at 136 E 1200 S, Bountiful, UT 84010 and is currently estimated at $747,847, approximately $171 per square foot. 136 E 1200 S is a home located in Davis County with nearby schools including Bountiful Elementary School, Millcreek Junior High School, and Bountiful High School.
Ownership History
Date
Name
Owned For
Owner Type
Purchase Details
Closed on
Feb 11, 2021
Sold by
Misener Gregory R and Misener Michelle Hansen
Bought by
Misener Gregory R and Misener Michelle Hansen
Current Estimated Value
Home Financials for this Owner
Home Financials are based on the most recent Mortgage that was taken out on this home.
Original Mortgage
$315,000
Outstanding Balance
$281,089
Interest Rate
2.7%
Mortgage Type
New Conventional
Estimated Equity
$466,758
Purchase Details
Closed on
Nov 14, 2019
Sold by
Misener Gregory R
Bought by
Misener Gregory R and Misener Michelle Hansen
Purchase Details
Closed on
Dec 5, 2016
Sold by
Lloyd Andrew
Bought by
Misener Gregory R
Purchase Details
Closed on
Mar 18, 2008
Sold by
Jordan John
Bought by
Madsen Scott
Purchase Details
Closed on
May 5, 2006
Sold by
Madsen Scott
Bought by
Jordan John
Home Financials for this Owner
Home Financials are based on the most recent Mortgage that was taken out on this home.
Original Mortgage
$230,000
Interest Rate
6.29%
Mortgage Type
Seller Take Back
Purchase Details
Closed on
Apr 10, 2001
Sold by
Madsen Evalyn S
Bought by
Madsen Scott E
Purchase Details
Closed on
Aug 16, 1999
Sold by
Madsen Evalyn S and Madsen Scott E
Bought by
Madsen Evalyn S
Purchase Details
Closed on
Mar 9, 1999
Sold by
Madsen Scott E
Bought by
Madsen Evalyn S and Madsen Scott E
Home Financials for this Owner
Home Financials are based on the most recent Mortgage that was taken out on this home.
Original Mortgage
$113,500
Interest Rate
6.77%
Purchase Details
Closed on
Feb 11, 1999
Sold by
Madsen Evalyn S and Madsen Scott E
Bought by
Madsen Scott E
Home Financials for this Owner
Home Financials are based on the most recent Mortgage that was taken out on this home.
Original Mortgage
$113,500
Interest Rate
6.77%
Purchase Details
Closed on
Sep 22, 1997
Sold by
Madsen Scott E
Bought by
Madsen Evalyn S and Madsen Scott E
Purchase Details
Closed on
Sep 12, 1997
Sold by
Madsen Evalyn S and Madsen Scott E
Bought by
Madsen Scott E
Purchase Details
Closed on
Aug 15, 1997
Sold by
Madsen Scott E
Bought by
Madsen Scott E and Madsen Evalyn S
Purchase Details
Closed on
May 16, 1996
Sold by
Madsen Evalyn S
Bought by
Madsen Evalyn S and Madsen Scott E
Home Financials for this Owner
Home Financials are based on the most recent Mortgage that was taken out on this home.
Original Mortgage
$75,000
Interest Rate
7.8%
Create a Home Valuation Report for This Property
The Home Valuation Report is an in-depth analysis detailing your home's value as well as a comparison with similar homes in the area
Purchase History
| Date | Buyer | Sale Price | Title Company |
|---|---|---|---|
| Misener Gregory R | -- | Title Guarantee | |
| Misener Gregory R | -- | None Listed On Document | |
| Misener Gregory R | -- | None Available | |
| Misener Gregory R | -- | Pinnacle Title | |
| Madsen Scott | $239,320 | Beehive Title Ins Agency Lc | |
| Jordan John | -- | None Available | |
| Madsen Scott E | -- | -- | |
| Madsen Evalyn S | -- | Backman Stewart Title Servic | |
| Madsen Evalyn S | -- | Backman Stewart Title Servic | |
| Madsen Scott E | -- | Backman Stewart Title Servic | |
| Madsen Evalyn S | -- | Backman Stewart Title Servic | |
| Madsen Scott E | -- | Backman Stewart Title Servic | |
| Madsen Scott E | -- | Backman Stewart Title Servic | |
| Madsen Evalyn S | -- | Backman Stewart Title Servic |
Source: Public Records
Mortgage History
| Date | Status | Borrower | Loan Amount |
|---|---|---|---|
| Open | Misener Gregory R | $315,000 | |
| Closed | Misener Gregory R | $315,000 | |
| Previous Owner | Jordan John | $230,000 | |
| Previous Owner | Madsen Scott E | $113,500 | |
| Previous Owner | Madsen Evalyn S | $75,000 |
Source: Public Records
Tax History
| Year | Tax Paid | Tax Assessment Tax Assessment Total Assessment is a certain percentage of the fair market value that is determined by local assessors to be the total taxable value of land and additions on the property. | Land | Improvement |
|---|---|---|---|---|
| 2025 | $4,382 | $403,150 | $147,872 | $255,278 |
| 2024 | $4,133 | $392,150 | $137,106 | $255,044 |
| 2023 | $3,914 | $673,000 | $247,595 | $425,405 |
| 2022 | $4,137 | $391,050 | $133,967 | $257,083 |
| 2021 | $3,849 | $558,000 | $175,522 | $382,478 |
| 2020 | $3,394 | $494,000 | $148,151 | $345,849 |
| 2019 | $3,219 | $456,000 | $144,854 | $311,146 |
| 2018 | $3,006 | $419,000 | $141,736 | $277,264 |
| 2016 | $2,043 | $151,305 | $62,195 | $89,110 |
| 2015 | $2,143 | $146,685 | $61,985 | $84,700 |
| 2014 | $2,191 | $148,500 | $61,985 | $86,515 |
| 2013 | -- | $133,830 | $45,066 | $88,764 |
Source: Public Records
Map
Nearby Homes
- 285 E 1100 S
- 141 E 1650 S
- 380 E 1500 S
- 288 E 1650 S
- 1350 S 200 W
- 545 S 100 E
- 650 S Main St Unit 6206
- 650 S Main St Unit 4104
- 650 S Main St Unit 9106
- 1314 S 200 W Unit 19
- 1820 S 50 W
- 323 Peach Ln
- 275 E Peach Ln S
- 190 W 1800 S
- 520 S Orchard Dr Unit 17
- 34 W 400 S
- 32 W 400 S
- 456 E 500 S
- 357 S 100 E
- 255 E 400 S
Your Personal Tour Guide
Ask me questions while you tour the home.