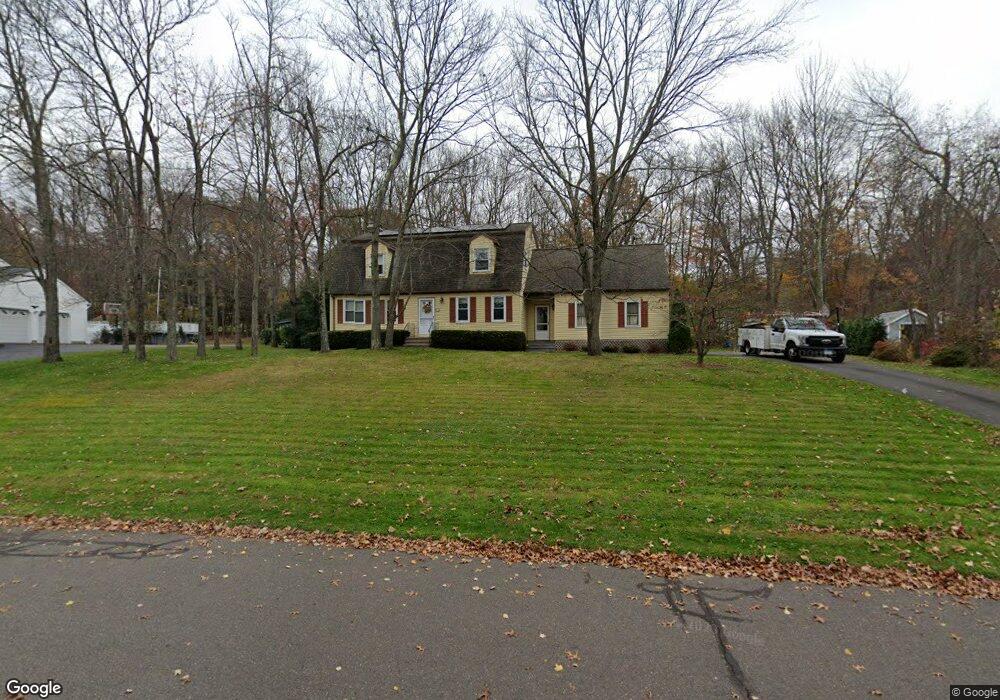
136 Garnet Ln South Windsor, CT 06074
Estimated Value: $494,000 - $589,000
3
Beds
4
Baths
1,886
Sq Ft
$294/Sq Ft
Est. Value
About This Home
This home is located at 136 Garnet Ln, South Windsor, CT 06074 and is currently estimated at $554,509, approximately $294 per square foot. 136 Garnet Ln is a home located in Hartford County with nearby schools including Timothy Edwards School and South Windsor High School.
Ownership History
Date
Name
Owned For
Owner Type
Purchase Details
Closed on
Feb 14, 2023
Sold by
Wapping Cemetery Assn Inc
Bought by
Williams Cliff and Williams Susan
Current Estimated Value
Purchase Details
Closed on
Aug 15, 1994
Sold by
Lopuszynski Adam and Lopuszynski Deborah
Bought by
Williams Clifford and Williams Susan
Home Financials for this Owner
Home Financials are based on the most recent Mortgage that was taken out on this home.
Original Mortgage
$51,000
Interest Rate
8.52%
Mortgage Type
Unknown
Create a Home Valuation Report for This Property
The Home Valuation Report is an in-depth analysis detailing your home's value as well as a comparison with similar homes in the area
Home Values in the Area
Average Home Value in this Area
Purchase History
| Date | Buyer | Sale Price | Title Company |
|---|---|---|---|
| Williams Cliff | $1,578 | None Available | |
| Williams Clifford | $184,000 | -- |
Source: Public Records
Mortgage History
| Date | Status | Borrower | Loan Amount |
|---|---|---|---|
| Previous Owner | Williams Clifford | $50,000 | |
| Previous Owner | Williams Clifford | $51,000 | |
| Previous Owner | Williams Clifford | $115,000 | |
| Previous Owner | Williams Clifford | $15,000 |
Source: Public Records
Tax History Compared to Growth
Tax History
| Year | Tax Paid | Tax Assessment Tax Assessment Total Assessment is a certain percentage of the fair market value that is determined by local assessors to be the total taxable value of land and additions on the property. | Land | Improvement |
|---|---|---|---|---|
| 2024 | $9,463 | $274,600 | $105,100 | $169,500 |
| 2023 | $9,100 | $274,600 | $105,100 | $169,500 |
| 2022 | $8,301 | $214,100 | $97,400 | $116,700 |
| 2021 | $8,106 | $214,100 | $97,400 | $116,700 |
| 2020 | $8,110 | $214,100 | $97,400 | $116,700 |
| 2019 | $8,243 | $214,100 | $97,400 | $116,700 |
| 2018 | $8,065 | $214,100 | $97,400 | $116,700 |
| 2017 | $8,134 | $213,600 | $97,400 | $116,200 |
| 2016 | $7,976 | $213,600 | $97,400 | $116,200 |
| 2015 | $7,805 | $213,600 | $97,400 | $116,200 |
| 2014 | $7,585 | $213,600 | $97,400 | $116,200 |
Source: Public Records
Map
Nearby Homes